A recent paper in Nature by Genzel et al. reports declining rotation curves for high redshift galaxies. I have been getting a lot of questions about this result, which would be very important if true. So I thought I’d share a few thoughts here.
Nature is a highly reputable journal – in most fields of science. In Astronomy, it has a well earned reputation as the place to publish sexy but incorrect results. They have been remarkably consistent about this, going back to my earliest grad school memories, like a quasar pair being interpreted as a wide gravitational lens indicating the existence of cosmic strings. This was sexy at that time, because cosmic strings were thought to be a likely by-product of cosmic Inflation, threading the universe with remnants of the Inflationary phase. Cool, huh? Many Big Names signed on to this Exciting Discovery, which was Widely Discussed at the time. The only problem was that it was complete nonsense.
Genzel et al. look likely to build on this reputation. In Astronomy, we are always chasing the undiscovered, which often means the most distant. This is a wonderful thing: the universe is practically infinite; there is always something new to discover. An occasional downside is the temptation to over-interpret and oversell data on the edge.
Lets start with some historical perspective. Here is the position-velocity diagram of NGC 7331 as measured by Rubin et al. (1965):

The rotation curve goes up, then it goes down. One would not claim the discovery of flat rotation curves from these data.
Here is the modern rotation curve of the same galaxy:
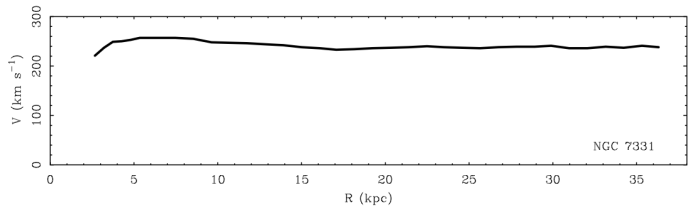
As the data improved, the flattening became clear. In order to see this, you need to observe to large radius. The original data didn’t do that. It isn’t necessarily wrong; it just doesn’t go far enough out.
Now lets look at the position-velocity diagrams published by Genzel et al.:

They go up, they go down. This is the normal morphology of the rotation curves of bright, high surface brightness galaxies. First they rise steeply, then they roll over, then they decline slowly and gradually flatten out.
It looks to me like the Genzel el al. data do the first two things. They go up. They roll over. Maybe they start to come down a tiny bit. Maybe. They simply do not extend far enough to see the flattening, if it is there. Their claim that the rotation curves are falling is not persuasive: this is asking more of the data than is warranted. Historically, there are many examples of claims of “declining” rotation curves. DDO 154 is one famous example. These claims were not very persuasive at the time, and did not survive closer examination.
I have developed the habit of looking at the data before I read the text of a paper. I did that in this case, and saw what I expected to see from years of experience working on low redshift galaxies. I wasn’t surprised until I read the text as saw the claim that these galaxies somehow differed from those at low redshift.
It takes some practice to look at the data without being influenced by lines drawn to misguide the eye. That’s what the model lines drawn in red do. I don’t have access to the data, so I can’t re-plot them without those lines. So instead I have added, by eye, a crude estimate of what I would expect for galaxies like this. In most cases, the data do not distinguish between falling and flat rotation curves. In the case labeled 33h, the data look slightly more consistent with a flat rotation curve. In 10h, they look slightly more consistent with a falling rotation curve. That appearance is mostly driven by the outermost point with large error bars on the approaching side. Taken literally, this velocity is unphysical: it declines faster than Keplerian. They interpret this in terms of thick disks, but it could be a clue that Something is Wrong.
The basic problem is that the high redshift data do not extend to large radii. They simply do not go far enough out to distinguish between flat and declining rotation curves. Most do not extend beyond 10 kpc. If we plot the data for NGC 7331 with R < 10 kpc, we get this:

Here I’ve plotted both sides in order to replicate the appearance of Genzel’s plots. I’ve also included an exponential disk model in red. Never mind that this is a lousy representation of the true mass model. It gives a good fit, no?
The rotation curve is clearly declining. Unless you observe further out:

The data of Genzel et al. do not allow us to distinguish between “normal” flat rotation curves and genuinely declining ones.
This is just taking the data as presented. I have refrained from making methodological criticisms, and will continue to do so. I will only note that it is possible to make a considerably more sophisticated, 3D analysis. Di Teodoro et al. (2016) have done this for very similar data. They find much lower velocity dispersions (not the thick disks claimed by Genzel et al.) and flat rotation curves:

There is no guarantee that the same results will follow for the Genzel et al. data, but it would be nice to see the same 3D analysis techniques applied.
Since I am unpersuaded that the Genzel et al. data extend far enough out to test for flat rotation, I looked for a comparison that I could make so far as the data do go. Fig. 3 of Genzel et al. shows the dark matter fraction as a function of circular velocity. This contains the same information as Fig. 12 of McGaugh (2016), which I re-plot here in terms of the dark matter fraction:

The data of Genzel et al. follow the trends established by local galaxies. They are confined to the bright, high surface brightness end of these relations, but that is to be expected: the brightest galaxies are always the most readily observed, especially at high redshift.
Genzel et al. only plot the left panel. As I have shown many times before, the strongest correlation of dynamical-to-baryonic mass is with surface brightness, not mass or its proxies luminosity and circular velocity. This is an essential aspect of the mass discrepancy problem; it is unfortunate that many scientists working on the topic appear to remain unaware of this basic fact.
From these diagrams, I infer that there is no discernible evolution in the properties of bright galaxies out to high redshift (z = 2.4 for their most distant case). The data presented by Genzel et al. sit exactly where one would expect from the relations established by local galaxies. That in itself might seem surprising, and perhaps warrants a Letter to Nature. But most of the words in Genzel et al. are about a surprising sort of evolution in which galaxy rotation curves decline at high redshift, so they have less dark matter then than now. I do not see that their data sustain such an interpretation.
So far everything I have said is empirical. If I put on a theory hat, the claims of Genzel et al. persist in making no sense.
First, ΛCDM. Fundamental to the ΛCDM cosmogony is the notion that dark matter halos form first, with baryons falling in subsequently. It has to happen in that order to satisfy the constraints on the growth of structure from the cosmic microwave background. The temperature fluctuations in the CMB are small because the baryons haven’t yet been able to clump up. In order for them to form galaxies as quickly as observed, the dark matter must already be forming the seeds of dark matter halos for the baryons to subsequently fall into. Without this order of battle, our explanation of structure formation is out the window.
Next, MOND. If rotation curves are indeed falling as claimed, this would falsify MOND, or at least make it a phenomenon that only applies in the local universe. But, as discussed, the high-z galaxies look like local ones. That doesn’t falsify MOND; it rather encourages the basic picture of structure formation we have in that context: galaxies form early and settle down into the form the modified force law stipulates. Indeed, the apparent lack of evolution implies that Milgrom’s acceleration constant a0 is indeed constant, and does not vary (as sometimes speculated) in concert with the expansion rate as hinted at by the numerical coincidence a0 ~ cH0. I cannot place a meaningful limit on the evolution of a0 from the data as presented, but it appears to be small. Rather than falsifying MOND, the high-z data look to be consistent with it – so far as they go.
So, in summary: the data at high redshift appear completely consistent with those at low redshift. The claim of falling rotation curves would be problematic to both ΛCDM and MOND. However, this claim is not persuasive – the data simply do not extend far enough out.
Early 21st century technology has enabled us to do at high redshift what could barely be done at low redshift in the mid-20th century. That’s impressive. But these high-z data look a lot like low-z data circa 1970. A lot has changed since then. Right now, for the exploration of the high redshift universe, I will borrow one of Vera Rubin’s favorite phrases: These are Early Days.

FYI, the Genzel et al. result is also inconsistent with MiHsC (QI), which predicts that a_0 should decline as the Universe expands; however, one would have to see quite deep indeed to make such observations to statistical certainty, and those observations are not possible with current technology.
LikeLike
I’ve heard people in several fields say that Nature (and Science) are highly reputable journals, but that in their field it’s known for publishing sexy but incorrect results…
LikeLiked by 1 person
Comment removed by request of its author.
LikeLike
Albert, very good. It is the data itself that must be scrutinized first, only then one looks at what the authors make of it
LikeLike
Gravity always attracts. Either MOND or acceleration of the universe are influenced by some attractive forces. MOND describes the flattening of rotation curves due to dark matter and I suspect an unknown gravity core boundary attracts the universe towards it.The total universe is going to fall on the gravity core. Gravity never repels. If the flattening of the rotation curves goes up it may be the influence of some black holes nearby. Anyway the property of gravity never changes.
LikeLiked by 1 person
The age of a galaxy certainly plays a role in rotation curves. Take for example our galaxy the milky way (MW )and Andromeda (M31 ). The rotation curve for MW is much elevated than that of M31this is despite the fact that M31 is more massive than MW. The difference can be explained if one takes cognisance of the fact that M 31 is younger than MW. In the Nexus Paradigm v=e^(Ht )(GMHc)^(1/4). Here we have a formula for galactic evolution or evolution of the BTFR.
LikeLike
Given the fact that there appears to be 5 times so called dark matter than baryonic matter giving a total of 6M at present epoch one can calculate the time of the beginning of the Dark Era to be 7.8 billion years ago using the above equation . This is also the approximate time when the universe began to accelerate. At earlier times, the galaxies would have had baryonic matter as the only constituent.
LikeLike
Thank you Prof McGaugh, this answers all the questions I had with regard to Genzel et al.
Excellent as always.
LikeLike
Thanks Stacy
That is a nice criticism (on both this paper and Nature itself). Also, high redhsift galaxies tend to be more compact (at least the part we can see, the baryons) as proven nicely by the recent work of Bouwens et al. 2016 (http://adsabs.harvard.edu/abs/2016arXiv160800966B). The increased compactness of the baryonic component would contribute to the rise and decline observed at high-z.
LikeLike
Absolutely. Certainly what we see locally is that more compact galaxies are more baryon dominated. These high-z observations are consistent with that – so far.
LikeLike
Stacy:
Dark matter fractions decrease with increasing redshift because the resolution of spectroscopy requires redshift wavelength changes < 1 angstrom at Z < 0.001. At high-redshift, the spectroscopic resolution is acceptable. What this means is vanishing dark matter fractions at high-redshift shows dark matter does not exist even at Z << 0.001. Newtonian mechanics governs the Universe!
But to show this is difficult as spectroscopy would have to be significantly improved. Even if so, any hope of showing this is difficult because galaxy velocities are dependent on redshift in cosmic dust. Perhaps, it is better to argue that the absence of dark matter at high-redshift also proves dark matter is absent at Z < 0.001.
Also, the dependence of dark matter on the shape of rotation curves is an antiquated notion from the 1970's. See: "Existence of dark matter depends on cosmic dust, not the shape of rotation curves!" at http://www.nanoqed.org, 2018
Thomas
LikeLike
“Taken literally, this velocity is unphysical: it declines faster than Keplerian.”
It appears to me that the expected Keplerian decline of galactic rotation curves is itself physically implausible given the very distinct morphologies of galaxies and the solar system.
LikeLike
Yes – one has to compute a mass model specific to the observed distribution of stars and gas in each galaxy. This is not point-like the way the sun is. The baryon-predicted rotation curve does not become Keplerian until very far away, when the galaxy begins to look like a point mass. Nevertheless, properly constructed mass models show declining rotation curves (if not exactly Keplerian) where they remain roughly flat.
LikeLike