This title is an example of what has come to be called Betteridge’s law. This is a relatively recent name for an old phenomenon: if a title is posed as a question, the answer is no. This is especially true in science, whether the authors are conscious of it or not.
Pengfei Li completed his Ph.D. recently, fitting all manner of dark matter halos as well as the radial acceleration relation (RAR) to galaxies in the SPARC database. For the RAR, he found that galaxy data were consistent with a single, universal acceleration scale, g+. There is of course scatter in the data, but this appears to us to be consistent with what we expect from variation in the mass-to-light ratios of stars and the various uncertainties in the data.
This conclusion has been controversial despite being painfully obvious. I have my own law for data interpretation in astronomy:
Obvious results provoke opposition. The more obvious the result, the stronger the opposition.
S. McGaugh, 1997
The constancy of the acceleration scale is such a case. Where we do not believe we can distinguish between galaxies, others think they can – using our own data! Here it is worth contemplating what all is involved in building a database like SPARC – we were the ones who did the work, after all. In the case of the photometry, we observed the galaxies, we reduced the data, we cleaned the images of foreground contaminants (stars), we fit isophotes, we built mass models – that’s a very short version of what we did in order to be able to estimate the acceleration predicted by Newtonian gravity for the observed distribution of stars. That’s one axis of the RAR. The other is the observed acceleration, which comes from rotation curves, which require even more work. I will spare you the work flow; we did some galaxies ourselves, and took others from the literature in full appreciation of what we could and could not believe — which we have a deep appreciation for because we do the same kind of work ourselves. In contrast, the people claiming to find the opposite of what we find obtained the data by downloading it from our website. The only thing they do is the very last step in the analysis, making fits with Bayesian statistics the same as we do, but in manifest ignorance of the process by which the data came to be. This leads to an underappreciation of the uncertainty in the uncertainties.
This is another rule of thumb in science: outside groups are unlikely to discover important things that were overlooked by the group that did the original work. An example from about seven years ago was the putative 126 GeV line in Fermi satellite data. This was thought by some at the time to be evidence for dark matter annihilating into gamma rays with energy corresponding to the rest mass of the dark matter particles and their anti-particles. This would be a remarkable, Nobel-winning discovery, if true. Strange then that the claim was not made by the Fermi team themselves. Did outsiders beat them to the punch with their own data? It can happen: sometimes large collaborations can be slow to move on important results, wanting to vet everything carefully or warring internally over its meaning while outside investigators move more swiftly. But it can also be that the vetting shows that the exciting result is not credible.
I recall the 126 GeV line being a big deal. There was an entire session devoted to it at a conference I was scheduled to attend. Our time is valuable: I can’t go to every interesting conference, and don’t want to spend time on conferences that aren’t interesting. I was skeptical, simply because of the rule of thumb. I wrote the organizers, and asked if they really thought that this would still be a thing by the time the conference happened in few months’ time. Some of them certainly thought so, so it went ahead. As it happened, it wasn’t. Not a single speaker who was scheduled to talk about the 126 GeV line actually did so. In a few short months, if had gone from an exciting result sure to win a Nobel prize to nada.

This happens all the time. Science isn’t as simple as a dry table of numbers and error bars. This is especially true in astronomy, where we are observing objects in the sky. It is never possible to do an ideal experiment in which one controls for all possible systematics: the universe is not a closed box in which we can control the conditions. Heck, we don’t even know what all the unknowns are. It is a big friggin’ universe.
The practical consequence of this is that the uncertainty in any astronomical measurement is almost always larger than its formal error bar. There are effects we can quantify and include appropriately in the error assessment. There are things we can not. We know they’re there, but that doesn’t mean we can put a meaningful number on them.
Indeed, the sociology of this has evolved over the course of my career. Back in the day, everybody understood these things, and took the stated errors with a grain of salt. If it was important to estimate the systematic uncertainty, it was common to estimate a wide band, in effect saying “I’m pretty sure it is in this range.” Nowadays, it has become common to split out terms for random and systematic error. This is helpful to the non-specialist, but it can also be misleading because, so stated, the confidence interval on the systematic looks like a 1 sigma error even though it is not likely to have a Gaussian distribution. Being 3 sigma off of the central value might be a lot more likely than this implies — or a lot less.
People have become more careful in making error estimates, which ironically has made matters worse. People seem to think that they can actually believe the error bars. Sometimes you can, but sometimes not. Many people don’t know how much salt to take it with, or realize that they should take it with a grain of salt at all. Worse, more and more folks come over from particle physics where extraordinary accuracy is the norm. They are completely unprepared to cope with astronomical data, or even fully process that the error bars may not be what they think they are. There is no appreciation for the uncertainties in the uncertainties, which is absolutely fundamental in astrophysics.
Consequently, one gets overly credulous analyses. In the case of the RAR, a number of papers have claimed that the acceleration scale isn’t constant. Not even remotely! Why do they make this claim?
Below is a histogram of raw acceleration scales from SPARC galaxies. In effect, they are claiming that they can tell the difference between galaxies in the tail on one side of the histogram from those on the opposite side. We don’t think we can, which is the more conservative claim. The width of the histogram is just the scatter that one expects from astronomical data, so the data are consistent with zero intrinsic scatter. That’s not to say that’s necessarily what Nature is doing: we can never measure zero scatter, so it is always conceivable that there is some intrinsic variation in the characteristic acceleration scale. All we can say is that if is there, it is so small that we cannot yet resolve it.
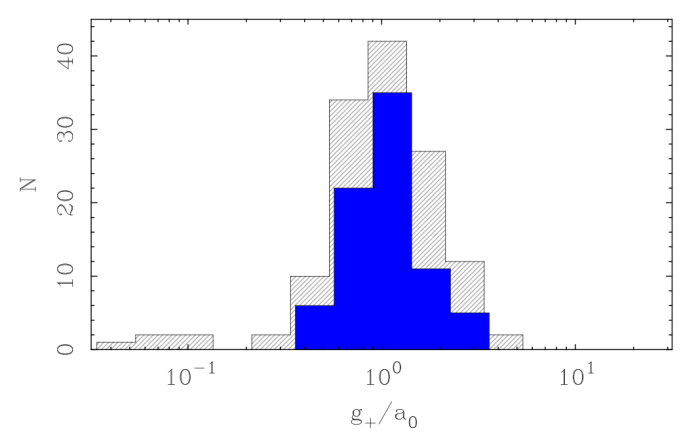
Posed as a histogram like this, it is easy to see that there is a characteristic value – the peak – with some scatter around it. The entire issue it whether that scatter is due to real variation from galaxy to galaxy, or if it is just noise. One way to check this is to make quality cuts: in the plot above, the gray-striped histogram plots every available galaxy. The solid blue one makes some mild quality cuts, like knowing the distance to better than 20%. That matters, because the acceleration scale is a quantity that depends on distance – a notoriously difficult quantity to measure accurately in astronomy. When this quality cut is imposed, the width of the histogram shrinks. The better data make a tighter histogram – just as one would expect if the scatter is due to noise. If instead the scatter is a real, physical effect, it should, if anything, be more pronounced in the better data.
This should not be difficult to understand. And yet – other representations of the data give a different impression, like this one:

This figure tells a very different story. The characteristic acceleration does not just scatter around a universal value. There is a clear correlation from one end of the plot to the other. Indeed, it is a perfectly smooth transition, because “Galaxy” is the number of each galaxy ordered by the value of its acceleration, from lowest to highest. The axes are not independent, they represent identically the same quantity. It is a plot of x against x. If properly projected it into a histogram, it would look like the one above.
This is a terrible way to plot data. It makes it look like there is a correlation where there is none. Setting this aside, there is a potential issue with the most discrepant galaxies – those at either extreme. There are more points that are roughly 3 sigma from a constant value than there should be for a sample this size. If this is the right assessment of the uncertainty, then there is indeed some variation from galaxy to galaxy. Not much, but the galaxies at the left hand side of the plot are different from those on the right hand side.
But can we believe the formal uncertainties that inform this error analysis? If you’ve read this far, you will anticipate that the answer to this question obeys Betteridge’s law. No.
One of the reasons we can’t just assign confidence intervals and believe them like a common physicist is that there are other factors in the analysis – nuisance parameters in Bayesian verbiage – with which the acceleration scale covaries. That’s a fancy way of saying that if we turn one knob, it affects another. We assign priors to the nuisance parameters (e.g., the distance to each galaxy and its inclination) based on independent measurements. But there is still some room to slop around. The question is really what to believe at the end of the analysis. We don’t think we can distinguish the acceleration scale from one galaxy to another, but this other analysis says we should. So which is it?
It is easy at this point to devolve into accusations of picking priors to obtain a preconceived result. I don’t think anyone is doing that. But how to show it?
Pengfei had the brilliant idea to perform the same analysis as Marra et al., but allowing Newton’s constant to vary. This is Big G, a universal constant that’s been known to be a constant of nature for centuries. It surely does not vary. However, G appears in our equations, so we can test for variation therein. Pengfei did this, following the same procedure as Mara et al., and finds the same kind of graph – now for G instead of g+.

You see here the same kind of trend for Newton’s constant as one sees above for the acceleration scale. The same data have been analyzed in the same way. It has also been plotted in the same way, giving the impression of a correlation where there is none. The result is also the same: if we believe the formal uncertainties, the best-fit G is different for the galaxies at the left than from those to the right.
I’m pretty sure Newton’s constant does not vary this much. I’m entirely sure that the rotation curve data we analyze are not capable of making this determination. It would be absurd to claim so. The same absurdity extends to the acceleration scale g+. If we don’t believe the variation in G, there’s no reason to believe that in g+.
So what is going on here? It boils down to the errors on the rotation curves not representing the uncertainty in the circular velocity as we would like for them to. There are all sorts of reasons for this, observational, physical, and systematic. I’ve written about this at great lengths elsewhere, and I haven’t the patience to do so again here. it is turgidly technical to the extent that even the pros don’t read it. It boils down to the ancient, forgotten wisdom of astronomy: you have to take the errors with a grain of salt.
Here is the cumulative distribution (CDF) of reduced chi squared for the plot above.

Two things to notice here. First, the CDF looks the same regardless of whether we let Newton’s constant vary or not, or how we assign the Bayesian priors. There’s no value added in letting it vary – just as we found for the characteristic acceleration scale in the first place. Second, the reduced chi squared is rarely close to one. It should be! As a goodness of fit measure, one claims to have a good fit when chi squared equal to one. The majority of these are not good fits! Rather than the gradual slope we see here, the CDF of chi squared should be a nearly straight vertical line. That’s nothing like what we see.
If one interprets this literally, there are many large chi squared values well in excess of unity. These are bad fits, and the model should be rejected. That’s exactly what Rodrigues et al. (2018) found, rejecting the constancy of the acceleration scale at 10 sigma. By their reasoning, we must also reject the constancy of Newton’s constant with the same high confidence. That’s just silly.
One strange thing: the people complaining that the acceleration scale is not constant are only testing that hypothesis. Their presumption is that if the data reject that, it falsifies MOND. The attitude is that this is an automatic win for dark matter. Is it? They don’t bother checking.
We do. We can do the same exercise with dark matter. We find the same result. The CDF looks the same; there are many galaxies with chi squared that is too large.

Having found the same result for dark matter halos that we found for the RAR, if we apply the same logic, then all proposed model halos are excluded. There are too many bad fits with overly large chi squared.
We have now ruled out all conceivable models. Dark matter is falsified. MOND is falsified. Nothing works. Look on these data, ye mighty, and despair.
But wait! Should we believe the error bars that lead to the end of all things? What would Betteridge say?
Here is the rotation curve of DDO 170 fit with the RAR. Look first at the left box, with the data (points) and the fit (red line). Then look at the fit parameters in the right box.

Looking at the left panel, this is a good fit. The line representing the model provides a reasonable depiction of the data.
Looking at the right panel, this is a terrible fit. The reduced chi squared is 4.9. That’s a lot larger than one! The model is rejected with high confidence.
Well, which is it? Lots of people fall into the trap of blindly trusting statistical tests like chi squared. Statistics can only help your brain. They can’t replace it. Trust your eye-brain. This is a good fit. Chi squared is overly large not because this is a bad model but because the error bars are too small. The absolute amount by which the data “miss” is just a few km/s. This is not much by the standards of galaxies, and could easily be explained by a small departure of the tracer from a purely circular orbit – a physical effect we expect at that level. Or it could simply be that the errors are underestimated. Either way, it isn’t a big deal. It would be incredibly naive to take chi squared at face value.
If you want to see a dozen plots like this for all the various models fit to each of over a hundred galaxies, see Li et al. (2020). The bottom line is always the same. The same galaxies are poorly fit by any model — dark matter or MOND. Chi squared is too big not because all conceivable models are wrong, but because the formal errors are underestimated in many cases.
This comes as no surprise to anyone with experience working with astronomical data. We can work to improve the data and the error estimation – see, for example, Sellwood et al (2021). But we can’t blindly turn the crank on some statistical black box and expect all the secrets of the universe to tumble out onto a silver platter for our delectation. There’s a little more to it than that.

Stacy,
as a physicist, I know that G cannot vary, but if I say why, it starts a discussion. Well, I still say it. G cannot vary for the same reason that c or h-bar cannot vary. There is no way to detect their variations, because all measurement units are based on them. So if they would vary, the units would vary as well, with the end result that you cannot detect the variation.
In other words, the question to ask anybody who claims that G varies is this: How exactly: over space? Over time? And how do you measure this variation? How do you define length units? Time units? In nature, a variation of G has drastic consequences that most people forget.
LikeLike
Consider the measurement of any physical quantity. If you measure it more than once, and the measurements differ, and there is no other explanation, then the value has changed and you have measured it. It is thus certainly possible in principle.
Yes, sometimes, especially with regard to dimensionless numbers, some combinations are measured and one cannot tell which has changed, but only the combination. But that does not mean that it is not possible in principle to measure the change in one constant.
Another red herring: some constants are now defined to be exact, because we are sure that they change so little that any such change is smaller than the uncertainties and unknown effects with other definitions. But even here, if G were to drop by 50 per cent tomorrow, we would definitely notice it.
LikeLiked by 1 person
If G dropped by 50% tomorrow, the size of the Earth would increase, the Planck length would increase, length units would increase, time units would increase, the size of the solar System would increase, the universe would increase in size, etc. Energy units would change, frequencies would change. Everything would be scaled by that change of G, because G enters all units we use. If G changes, all Planck units and thus all SI units would change accordingly. In the end, you would just not notice anything.
This is a fun intellectual exercise that is not so well known. This is also the deep underlying reason that you can work with units where one sets G=1. You can do this even if G “varies”, because there is no way to detect such variations.
The only way to detect a varying G would be if G varies for some parts of nature and not for others. But this is pure fantasy.
LikeLike
Simply wrong, for two reasons. First, not everything (the size of atoms, for instance) depends on G. Second, things that do, do not all depend on the same powers of G.
Do you think that people who look for changes in such quantities are simply stupid?
LikeLike
It is just that many people forget the dependence or do not want to see it. At first sight, nothing in the world depends on G: neither atoms size, Earth size, shoe size, etc. But then you need to think again, with more care. You cannot measure a variation of G in nature.
The same is valid for c and for hbar. I said that the discussions are long and heated. I have seen them so often… There are even papers (not by me) on this topic, with rebuttals, and counter-rebuttals. I have friends who spent their life to measure variations. And what did they find? Nothing.
G, hbar and c are natural units. All human measurements are fractions or multiples of natural units. There is no way to measure their changes.
LikeLike
Consider a paper with the title:
If a paper has a question mark in the title, is the answer always no?
LikeLike
Yes, this is a rich subject – with a long literature I have not attempted to address here. There are good constraints on time variation of some of these constants, or at least combinations of them. For example, atomic transitions observed in high redshift QSOs are indistinguishable from the same transition at low redshift, strongly constraining temporal variation in the fine structure constant. That said, the variations I’m talking about in this post are far more gross than any of that. Your concerns are valid at a much higher level than the literature under discussion.
LikeLike
Very nice explanation! Thanks for this post (& the others) 🙂
LikeLike
An important astronomy professor in Zurich once told a student of mine that it is OK to publish a research paper on MOND as long as this paper shows MOND to be wrong. Interestingly, Zurich has later been largely closed down because of scandals there.
I take 10sigma discrepancies very seriously indeed, but the claims by Rodrigues et al. have been shown to be untenable:
https://ui.adsabs.harvard.edu/abs/2018NatAs…2..925K/abstract
“A common Milgromian acceleration scale in nature”
Related to this is are the wild claims by van Dokkum that the galaxy lacking dark matter they describe falsifies MOND:
https://ui.adsabs.harvard.edu/abs/2018Natur.555..629V/abstract
Three referees and the editors of Nature were not able to (or did not want to) find very elementary errors in the calculations, leading to three rebuttals:
1) https://ui.adsabs.harvard.edu/abs/2018Natur.561E…4K/abstract
“Does the galaxy NGC1052-DF2 falsify Milgromian dynamics?”
2) https://ui.adsabs.harvard.edu/abs/2019MNRAS.487.2441H/abstract
“A new formulation of the external field effect in MOND and numerical simulations of ultra-diffuse dwarf galaxies – application to NGC 1052-DF2 and NGC 1052-DF4”
3) https://ui.adsabs.harvard.edu/abs/2018MNRAS.480..473F/abstract
“MOND and the dynamics of NGC 1052-DF2”
In the end, this little galaxy lacking dark matter turns out to actually falsify the LCDM model:
https://ui.adsabs.harvard.edu/abs/2019MNRAS.489.2634H/abstract
“The ultra-diffuse dwarf galaxies NGC 1052-DF2 and 1052-DF4 are in conflict with standard cosmology”
It seems there is something not quite right in terms of how the establishment is doing research in the dark-matter sector.
LikeLike
An important astronomy professor in Zurich once told a student of mine that it is OK to publish a research paper on MOND as long as this paper shows MOND to be wrong. Interestingly, Zurich has later been largely closed down because of scandals there.
True, but there is hardly any reason to connect the two facts. Good and bad science is done by good and bad people.
(Pavel is referring to the (former) astronomy department at the ETH in Zurich. That at the University of Zurich (a different school) is alive and well.)
LikeLike
Dear Dr. McGaugh, Stacy,
For the first 58 years of my life I have had great admiration and respect for scientists in general, and especially physicists, cosmologists, and astronomers (or whatever taxonomy you want to use for the fields that study the basis of nature and the universe). Unfortunately, for the subsequent three years my experience has been dominated by deep frustration with the scientists in these fields for several reasons :
They don’t respect their known unknowns.
They have built incorrect narrative castles in the air that have persisted, with confidence, despite major tensions and the aforementioned unknowns.
Many of the captive scientists in the ivory tower look outside at the clamoring ideators and click ignore, mute, delete, next despite the clear crisis in both physics and cosmology.
Some of the guards of the ivory tower exhibit hateful and bullying behaviour towards ideators. I am concerned, less for me, but more for the new entrants in the field that do not thrive in a macho culture dominated by intellectual superiority, egos, politics, and power games.
I’ve railed against #3 and #4 before, but hopefully progress will improve once scientists get this enormous mess cleaned up and the fields onto a solid fundamental foundation. Let’s focus on issues #1 and #2.
Your blog post is about the acceleration of gravity in galaxies. Let’s list a few things that are unknown.
Einstein’s general relativity is our best theory of gravity, but it is not yet integrated with quantum mechanics.
We don’t understand how spacetime is physically implemented.
We do understand that Einstein’s singularity in the central SMBH is a problematic issue, yet the actual mechanism to replace the singularity in the theory does not appear to even have a placeholder for its influence on the models of galaxy dynamics. Imagine, that, the most concentrated matter-energy in the universe is waved away because it is inside an event horizon of its own creation.
We don’t have a complete tension free theory for a one-time inflationary big bang.
We don’t have a complete tension free theory of expansion.
While the energy held in spacetime is factored into general relativity, we don’t understand the physical implementation of spacetime energy storage nor how gravitational forces are transmitted.
We don’t even understand how standard matter particles store energy and are able to transact energy in spin * h-bar units of angular momentum!
Yet, despite all this missing knowledge, scientists have been incredibly bold in constructing their castle in the air narratives. There is nothing wrong with imagining such narratives, but talk about error bounds and uncertainties Stacy! The errors in the narratives of GR, QM, and LCDM are such whoppers that it is truly amazing that the scientists have managed to put together a semi-functional but massively distorted castle in the air that could have been designed by a committee of Picasso, Escher, Dali, and Chagall.
It only takes a bit of reading about science to understand that nature is a trickster. There are so many possible interpretations of observations when developing a model from a blank sheet of paper or more likely, building upon the work of prior scientists that has become ‘accepted canon’ by a process that often has more to do with ego and power hierarchy than should be acceptable in a scientific field. So we have an enormous pile of tremendous interpretations lying around like partially solved discarded Rubik’s cubes that couldn’t find the final twists to bring everything together coherently.
Several eminent and rational scientists have noted over the years that the fields are in crisis due to lack of progress. Yet it appears to be rare for any creative efforts to be mounted to seriously revisit the major branching decision points in the tree of physics and cosmology knowledge. Here is an easy one that most readers of this blog can do on their own.
Revisit the concept of point charges. Fix the singularity issue by making your point charges immutable. Give them a radius of the Planck length divided by 2*pi, but still have the point charge point of action be the center point of this virtual sphere of immutability. Continue applying the Planck scale as if it is physical (it is). At the very highest energy an isolated pair of equal and opposite point charges, each carrying the Planck energy will be adjacent and orbiting each other at c (as if each point charge sphere of immutability was rolling friction free over the surface of the other). Now you have the Tau dipole. Take away an h-bar/2 worth of angular momentum. What happens? Write down the static equations for electromagnetic fields generated by each particle and the resulting forces. Add the classic mechanics equations. You will find that the orbital radius has slightly increased from twice the radius, Lp/pi to Lp/pi + delta r. Keep taking away energy corresponding to multiples of h-bar/2 angular momentum. The radius of the dipole rotation gets larger and larger. The frequency starts at the Planck frequency and changes by 1 Hz for every spin * h-bar delta in energy. Now your dipole is a stretchy ruler and a variable clock. Your point charge dipole operates in quanta of energy. Uncertainty is the tipping point between levels. There is no magic. Keep going. The whole universe will reveal itself to you.
This is just the tip of the iceberg. It is absolutely amazing what you will find if you follow this line of investigation. The discoveres are directly material to how gravitation is physically implemented and how the behaviours of SMBH impact galaxy dynamics.
LikeLike
I have no idea how to respond to this.
LikeLiked by 2 people
Well it looks like a word salad. I think you’re supposed to eat it.
LikeLiked by 1 person
“We don’t have a complete tension free theory for a one-time inflationary big bang.
We don’t have a complete tension free theory of expansion.
While the energy held in spacetime is factored into general relativity, we don’t understand the physical implementation of spacetime energy storage”
Good points J Mark Morris as corrected in Suntola’s Dynamic Universe structural system since mid 1995 and confirmed by my unified math field of array algebra photogrammetry and geodesy is surveying sciences and theory of estimation. See my other comments below about loop inverse estimation theory and DU literature as confirmed by 3 Dec 2020 Gaia EDR3 flow chart of DU 4-D metric space as 3-D surface of Riemann 4-sphere.
LikeLike
This really is a lovely little paper. The phrase “throwing shade” doesn’t do it justice. I can’t imagine Rodrigues and associates will keep repeating their claims after this.
While I’m here I’m hoping you or someone else could shed some light on something I came across. So last July Kyle Oman gave a talk at UFES which showed some preliminary (unpublished) weak lensing data from GAMA + KiDS extending the RAR by three orders of magnitude of g_bar, all the way down to 10^-15m/s^2. Very impressive if the data survives peer review. See pages 24 and 25 of his slides:
https://www. cosmo-ufes.org/uploads/1/3/7/0/13701821/kyle_oman_talk_ufes_2020.pdf
What struck me were the ellipticals which were slightly but consistently above/to the left of the RAR with some very (unrealistically?) small error bars. This shift up is almost exactly the same as for the cluster cores in the papers by Tian et al (2001.08340) and Chan & Del Popolo (2001.06141).
Could this mean, if the data prove to be accurate, that ellipticals are at least partly suffering from the same problem as clusters? Or could this simply be a case of unrealistically low choices of the M/L ratio for the ellipticals? Or is there some other parameter that could cause such a misalignment?
I’d like to know what to look out for when the data and paper is finally really published or put on the archive.
LikeLiked by 1 person
Yes, that’s very important. You can see the lensing signal already in the work of Brouwer et al (2017 I think) on testing Emergent Gravity. In that limit, it converges to the same thing as MOND. So at an astronomical accuracy level, it is amazing consistency that the RAR/MOND/whatever it is extrapolates over several decades that well.
As for an offset between ellipticals and spirals – could be. There are persistent indications to that effect. The E & S0 galaxies we analyzed in Lelli et al (2017) were consistent with the RAR if their stellar mass-to-light ratios were higher than those of spirals. I forget the shift now – it wasn’t a factor of two, but it wasn’t too far shy of that either. That could just be a population effect, or it could be a systematic offset. I think one could argue it either way: it was clear enough that there had to be some shift, but nothing so large that it couldn’t just be a population difference.
To get to such low accelerations, one has to go way far out, at which point the hot gas in galactic corona can’t be ignored in the baryon budget. Brouwer assumed it was something like three times the stellar mass, which seemed like a lot to me. But I have no intuition for this… if ellipticals are like little clusters, then maybe they do have more baryons in their corona than in their stars. That seems like a big systematic to settle before believing an offset like that seen in clusters – though I agree it is intriguing. Even so, the real story would seem to be the three order of magnitude extrapolation rather than a moderate offset.
Are these in fact the same data? I had suggested to Brouwer that she do a RAR analysis, but hadn’t wanted to pester her about it.
LikeLike
It’s newer data than Brouwer used in 2017. At least according to Oman in (2006.06700) where he talks about the companion paper for a bit. “The ESD profiles published in Brouwer et al. (2017, see their fig. 3) are constructed from galaxy shape measurements from the (at the time partially completed) Kilo-Degree Survey”. “Guided by Fig. 5, we explore below whether current GGL measurements are likely to yield interesting constraints on the low-acceleration behaviour of the RAR; a more thorough analysis leveraging the (now completed) KiDS survey data set will be presented in a companion paper (Brouwer et al., in preparation).”
LikeLike
Thanks for the reference. Reading it reminds me why I have decided to ignore that group. There are statements in the abstract that are simply wrong. In the text, they make a big deal about how maybe the observed slope of the Milky Way rotation curve is inconsistent with the RAR. They appear to have missed that the observed slope was *predicted* by the RAR, as discussed in 1909.11158, a paper they don’t appear to be aware of.
I used to take these things very seriously, and examine each claim in detail. After doing this for a quarter century, I’ve decided to be done with fixing other people’s mistakes. Life is too short.
LikeLike
Yeah they’re assuming everything beyond a certain radius is in the deep MOND regime. Which is like working with a gravimeter and assuming the Earth is a perfect oblate spheroid. While in the mean time completely ignoring the giant 15,000 ft mountain right next door. And then when the measurements come in concluding that: “Newton’s law of gravity doesn’t seem to hold!” Well go figure.
The analysis of the dwarf spheroidals is similarly missing the point although at least they are aware of the paper by you and Wolf (1003.3448) that shows the further from the RAR the further out of equilibrium the object is.
LikeLike
I have posted before about the delights of waking up to a blog from Tritonstation.
Can I understand all the blogs?
Betteridge is right again. But there are usually a few jewels –
“Heck, we don’t even know what all the unknowns are. It is a big friggin’ universe.”
“Statistics can only help your brain. They can’t replace it. Trust your eye-brain. This is a good fit.”
Stay safe
LikeLiked by 2 people
In 1986 I published a paper with a question mark in the title. Was the answer no? Yes, it was!
LikeLiked by 1 person
It may be a big friggin universe, but it can be a small world. We’re in full lockdown again, so I spend too much time with my phone. Twitter told me about a 1 hr interview with Dr Hossenfelder on Bullaki. Nothing else to do.
Here I learn if her interest in MOND so I Google Dr H and the Prof. McGaugh. Couple more presses and I’m looking at the same graphs and her unique explanations.
If you’re interested in 300 hamsters or Newton’s conversation with Bob check out Backreaction, 23rd July 2018.
It made sense to me.
Actually I was looking to see if you’d done an interview with her.
The Bee and Stacy show?
LikeLike
I have certainly communicated with Dr. Hossenfelder. I haven’t done an interview with her. I guess she has a youtube channel, but I don’t follow that sort of thing. Coals to Newcastle.
LikeLike
A new paper in Nature Astronomy https://www.nature.com/articles/s41550-020-01285-w announcing the identification of 9 new stars in the Tucana II galaxy. Of course, they are interpreting it in terms of an extended halo of dark matter.
LikeLike
Of course. We made predictions for this object in Pawlowski et al 2015 (1505.07465 – see Table 5 in https://academic.oup.com/mnras/article/453/1/1047/1749113). I don’t have access to Nature at the moment, so don’t know how that works out. A lot of these very low mass dwarfs are subject to tidal effects, complicating the interpretation of the velocity dispersions. It must be challenging to confidently identify member stars all the way out to nine half-light radii, where they’d be very susceptible to tides.
LikeLike
Error propagation of random vs quasi-systematic errors is known under name ‘Fool’s Paradise’ coined by D.C. Brown in analytical photogrammetry. It is related to my loop inverse and array algebra expansion of mathematical statistics for general theory of estimation in typical hierarchical datum problems of astronomy and astrophysics. Simple example is ‘time’ in terms of local General Relativity (GR) theory vs its cosmic expansion of Dynamic Universe (DU) by Dr Suntola of Finland since mid 1990’s.
The present age or elapsed time from T4=0 epoch of expansion radius R4 of Riemann (&Feynman) 4-sphere at metric distance unit of 13.8 B lys is 13.8 B years according to GR based cosmologies based on the flawed starting postulate of c=C4= constant where c is speed of light along 3-D space as surface of 4-sphere and C4 is expansion speed of R4. The dynamic age of DU is T4=2/3 13.8 =9.2 B years – systematic datum difference already in first decimal vs 15-18th decimal of random errors in local time mensuration of GPS atomic clock! DU energy balance law established the physical connection among R4,T4,C4 and F4=1/T4 needed in computation of ‘acceleration vs deceleration’ of R4 or C4 in time units such as ‘dynamic’ Hubble constant in units of km/s/Mpc=1/s vs local measure m/s/s. 3 Dec 2020 Gaia EDR3 determined Sun ‘acceleration’ toward Milky Way center in terms of 2.32 10^-10 m/s/s local time measure. But in terms of DU this needs be converted into cosmic deceleration units of C4 vs apparent or mistaken ‘accelerated’ dR4 expansion steps of present Hubble crisis.
LikeLike
Your remark that “Obvious results provoke opposition. The more obvious the result, the stronger the opposition” really struck a chord with me. Then I followed the link, and found the even more wonderful “you can lead a theorist to data, but you can’t make him think”. I am a mathematician. If I want to do mathematical modelling, I first look at the data, and then I think. When I first started working with theoretical physicists I was flabbergasted to discover that they apparently don’t do this. I presented some data that I thought were relevant to the problem under discussion. It doesn’t really matter whether the data were relevant or not. What matters is that they refused to think, or even consider the data, because they “knew” it was not relevant. I still think that some of that data (not all of it) is relevant to the problem, but of course I could be wrong. On the other hand, I have still not found a theoretical physicist who is prepared to think *before* rejecting the idea.
LikeLike
Your comment confirms Lord Kelvin’s idea of loop inverse estimation in array algebra: “When you can measure it, you know something about the physical process you measured”. This is reflected in C.R.Rao definition of unbiasedly estimable functions of math model parameters X in Gauss-Markov model E(L)=A X or E(V)=0 for observables L+V containing random residual errors V. The general solution space of linear equations AX=L+V is found in the inverse theory by X=GL + (I- GA)U where n,1 vector U of ‘wave function’ in quantum physics is arbitrary. The definition for function(s) F X to be estimable becomes F-FGA=0. Thus ALL elements of observed data L are u.e even under the special condition A=AGA of g-inverse G of A. Proving your point.
The basic idea of loop inverses expands this to more general operators. They typically satisfy G=GAG condition with the practical modeling idea of selecting the TRUE values of minimum set L0=A0 X in L as your new well-conditioned modeling parameters. They span the observable space in terms of rank(A)=p>B) systems of equations with inexpensive computers such as in automated 4-D metric stereo mensuration/encoding of human eye-brain vision in Suntola Dynamic Universe, see my 12/2013 jogs paper or its early references from my HUT and KTH academic studies since 1968.
LikeLike
I suspect this is a bot running a markov chain – you mentioned eye-brain and then they wrote about it with a ‘dynamic universe’ and ‘inexpensive computers’. It’s a big word salad.
LikeLike
Sorry Kirk, one sentence was missing in my “They span the observable space in terms of rank(A)=p>B) systems of equations”
The system of equations in terms of u.e. L0 parameters (true values of p observables as basis function) has full rank=p that can even be less than rank(A) in photogrammetric scale invariant systems. Thus regular Gaussian l.s. solution using observed L+V gets applicable for the adjusted basis functions in space domain. This general idea of filtering in signal processing is related to convolution and fast transform operators (Cooley-Tukey tensor or Kronecker products) thereby expanding Einstein’s summation convention of restricted tensor notations to general multi-D Cayley matrix operators. Where p>billions of tensor product structure would require op(p^3)=10^27 arithmetic operations vs. the ‘fast’ or smart software op(p)=10^9.
This ‘fast’ solution allows industrial array algebra applications to compete with super computers using just general purpose PC level computers – and still beat the speed of human eye-brain stereo mensuration by factor >1,000, see my jogs paper and its references. This may become coveted technology when Gaia EDR3 results of 5 year mission will be compressed to continuous online processes in terms of the proven DU and array algebra based image surveying and cosmic range sensing system.
LikeLike
Ah. That explains it.
LikeLike
The title of the Einstein-Podolsky-Rosen paper was a question: Can quantum-mechanical description of physical reality be considered complete? The authors were in no doubt that the answer was “no”. Posterity appears to have decided otherwise. (Incorrectly, IMHO!)
LikeLike