The MHONGOOSE survey of atomic gas in and around galaxies

The MHONGOOSE survey of atomic gas in and around galaxies

I have been spending a lot of time lately writing up a formal paper on high redshift galaxies, so haven’t had much time to write here. The paper is a lot more involved than I told you so, but yeah, I did. Repeatedly. I do have a start on a post on self-interacting dark matter that I hope eventually to get back to. Today, I want to give a quick note about the MHONGOOSE survey. But first, a non-commercial interruption.


Triton Station joins Rogue Scholar

In internet news, Triton Station has joined Rogue Scholar. The blog itself hasn’t moved; Rogue Scholar is a community of science blogs. It provides some important capabilities, including full-text search, long-term archiving, DOIs, and metadata. The DOIs (Digital Object Identifiers) were of particular interest to me, as they have become the standard for identifying unique articles in regular academic journals now that these have mostly (entirely?) gone on-line. I had not envisioned ever citing this blog in a refereed journal, but a DOI makes it possible to do so. Any scientists who find a post useful are welcome to make use of this feature. I’m inclined to follow the example of JCAP and make the format volume, page be yearmonth, date (YYMM, DD), which comes out to Triton Station (2022), 2201, 03 in the standard astronomy journal format. I do not anticipate continuing to publish in the twenty second century, so no need for YYYYMM, Y2K experience notwithstanding.

For everyone interested in science, Rogue Scholar is a great place to find new blogs.


MHONGOOSE

In science news, the MHONGOOSE collaboration has released its big survey summary paper. Many survey science papers are in the pipeline. Congratulations to all involved, especially PI Erwin de Blok.

Erwin was an early collaborator of mine who played a pivotal role in measuring the atomic gas properties of low surface brightness galaxies, establishing the cusp-core problem, and that low surface brightness galaxies are dark matter dominated (or at least evince large mass discrepancies, as predicted by MOND). He has done a lot more since then, among them playing a leading role in the large VLA survey of nearby galaxies, THINGS. In astronomy we’re always looking forward to the next big survey – its a big universe; there’s always more out there. So after THINGS he conceived and began work on MHONGOOSE. It has been a long road tied to the construction of the MeerKAT array of radio telescopes – a major endeavor on the road to the ambitious Square Kilometer Array.

I was involved in the early phases of the MHONGOOSE project, helping to select the sample of target galaxies (it is really important to cover the full dynamic range of galaxy properties, dwarf to giant) and define the aspirational target sensitivity. HI observations often taper off below a column density of 1020 hydrogen atoms per cm2 (about 1 solar mass per square parsec). With work, one can get down to a few times 1019 cm-2. We want to go much deeper to see how much farther out the atomic gas extends. It was already known to go further out than the stars, but how far? Is there a hard edge, or just a continuous fall off?

We also hope to detect new dwarf galaxies that are low surface brightness in HI. There could, in theory, be zillions of such things lurking in all the dark matter subhalos that are predicted to exist around big galaxies. Irrespective of theory, are there HI gas-rich galaxies that are entirely devoid of stars? Do such things exist? People have been looking for them a long time, and there are now many examples of galaxies that are well over 95% gas, but there always seem to be at least a few stars associated with them. Is this always true? If we have cases that are 98, 99% gas, why not 100%? Do galaxies with gas always manage to turn at least a little of it into stars? They do have a Hubble time to work on it, so it is also a question why there is so much gas still around in these cases.

And… a lot of other things, but I don’t want to be here all day. So just a few quick highlights from the main survey paper. First, the obligatory sensitivity diagram. This shows how deep the survey reaches (lower column density) as a function of resolution (beam size). You want to see deeply and you want to resolve what you see, so ideally both of these numbers would be small. MHONGOOSE undercuts existing surveys, and is unlikely to be bettered until the full SKA comes on-line, which is still a long way off.

Sensitivity versus resolution in HI surveys.

And here are a couple of individual galaxy observations:
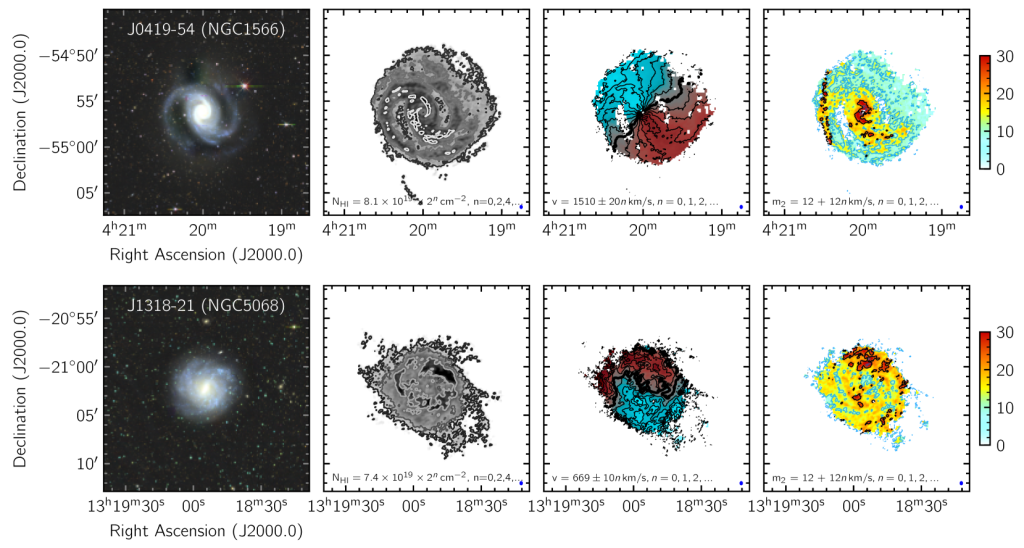
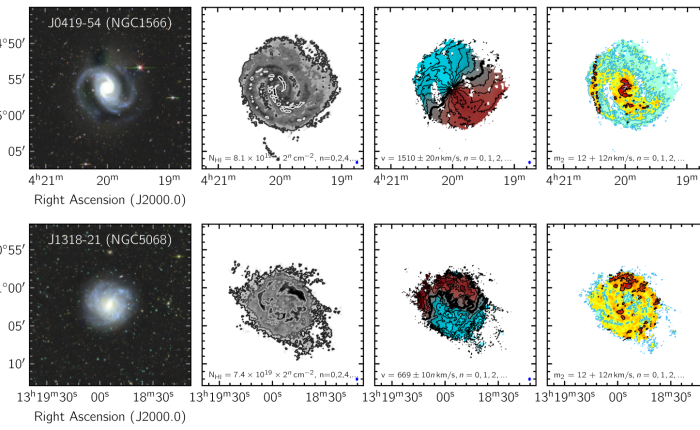
Optical images and the HI moment zero, one, and two maps. The moment zero map of the intensity of 21 cm radiation tells us where the atomic gas is, and how much of it there is. The moment one map is the velocity field from which we can construct a rotation curve. The second moment measures the velocity dispersion of the gas.

These are beautiful data. The spiral arms appear in the HI as well as in starlight, and continue in HI to larger radii. The outer edge of the HI disk is pretty hard; there doesn’t seem to be a lot of extra gas at low column densities extending indefinitely into the great beyond. I’m particular struck by the velocity dispersion of NGC 1566 tracking the spiral structure: this means the spiral arms have mass, and any stirring caused by star formation is localized to the spirals where much of the star formation goes on. That’s natural, but the surroundings seem relatively unperturbed: feedback is happening locally, but not globally. The velocity field of NGC 5068 has a big twist in the zero velocity contour (the thick line dividing the red receding side from the blue approaching side); this is a signature of non-circular motion, probably caused in this case by the visible bar. These are two-dimensional examples of Renzo’s rule (Sancisi’s Law), in which features in the visible mass distribution correspond to features in the kinematics.

I’ll end with a quick peak at the environments around some MHONGOOSE target galaxies:
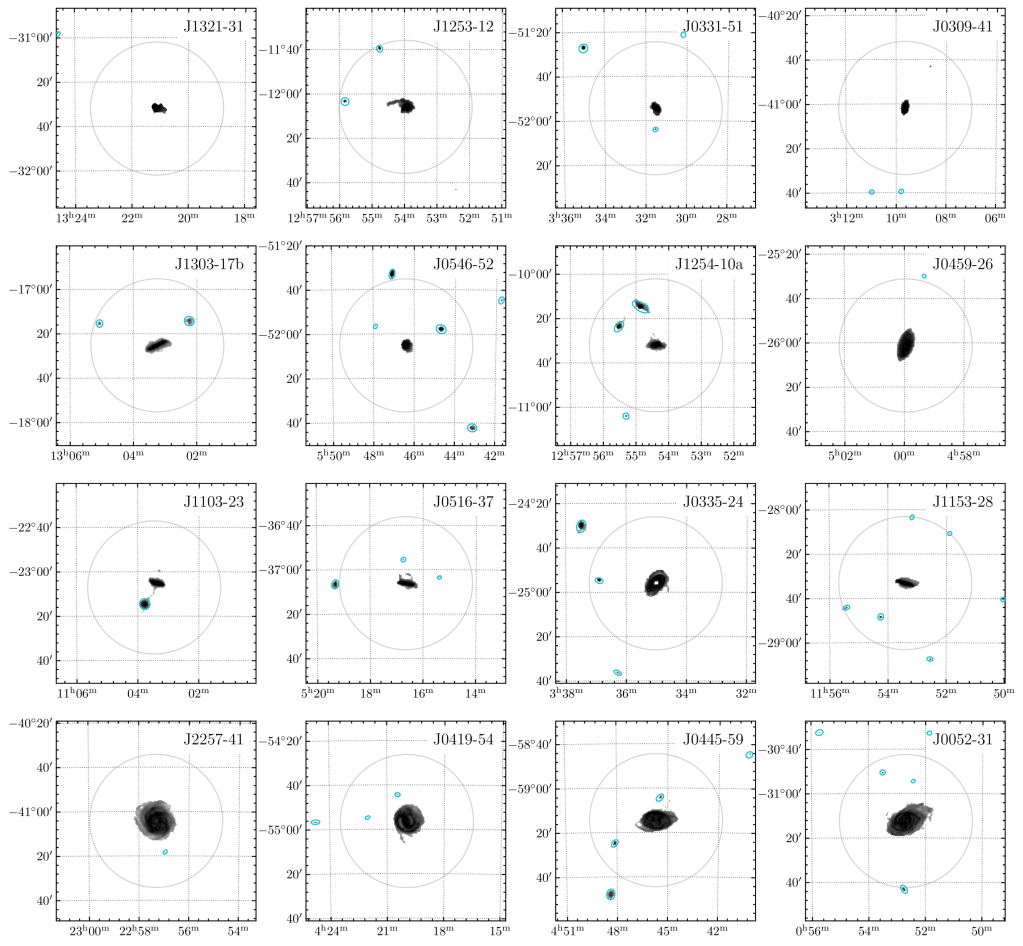
Fields where additional galaxies (in blue) are present around the central target.

This is nifty on many levels. First, some (presumptively satellite) dwarf galaxies are detected. That in itself is a treat to me: once upon a time, Renzo Sancisi asked me to smooth the bejeepers out of the LSB galaxy data cubes to look for satellites. After much work, we found nada. Nothing. Zilch. It turns out that LSB galaxies are among the most isolated galaxy types in the universe. So that we detect some things here is gratifying, even in targets that are not LSBs.

Second, there are not a lot of new detections. The halos of big galaxies are not swimming in heretofore unseen swarms of low column density gas clouds. There can always be more at sensitivities yet unreached, but the data sure don’t encourage that perspective. MHONGOOSE is sensitive to very low mass gas clouds. The exact limit is distance-dependent, but a million solar masses of atomic gas should be readily visible. That’s a tiny amount by extragalactic standards, about one globular cluster’s worth of material. There’s just not a lot there.

Disappointing as the absence of zillions of new detections may be discovery-wise, it does teach us some important lessons. Empirically, galaxies look like island universes in gas as well as stars. There may be a few outlying galaxies, but they are not embedded in an obvious cosmic network of ephemeral cold gas. Nor are there thousands of unseen satellites/subhalos suddenly becoming visible – at least not in atomic gas. Theorists can of course imagine other things, but we observers can only measure one thing at a time, as instrumentation and telescope availability allows. This is a big step forward.
Primer on Galaxy Properties

Primer on Galaxy Properties

When we look up at the sky, we see stars. Stars are the building blocks of galaxies; we can see the stellar disk of the galaxy in which we live as the vault of the Milky Way arching across the sky. When we look beyond the Milky Way, we see galaxies. Just as stars are the building blocks of galaxies, galaxies are the building blocks of the universe. One can no more hope to understand cosmology without understanding galaxies than one can hope to understand galaxies without understanding stars.

Here I give a very brief primer on basic galaxy properties. This is a subject on which entire textbooks are written, so what I say here is necessarily very incomplete. It is a bare minimum to go on for the ensuing discussion.

Galaxy Properties

Cosmology entered the modern era when Hubble (1929) resolved the debate over the nature of spiral nebulae by measuring the distance to Andromeda, establishing that vast stellar systems — galaxies — exist external to and coequal with the Milky Way. Galaxies are the primary type of object observed when we look beyond the confines of our own Milky Way: they are the building blocks of the universe. Consequently, galaxies and cosmology are intertwined: it is impossible to understand one without the other.

Here I sketch a few essential facts about the properties of galaxies. This is far from a comprehensive list (see, for example Binney & Tremaine, 1987) and serves only to provide a minimum framework for the subsequent discussion. The properties of galaxies are often cast in terms of morphological type, starting with Hubble’s tuning fork diagram. The primary distinction is between Early Type Galaxies (ETGs) and Late Type Galaxies (LTGs), which is a matter of basic structure. ETGs, also known as elliptical galaxies, are three dimensional, ellipsoidal systems that are pressure supported: there is more kinetic energy in random motions than in circular motions, a condition described as dynamically hot. The orbits of stars are generally eccentric and oriented randomly with respect to one another, filling out the ellipsoidal shape seen in projection on the sky. LTGs, including spiral and irregular galaxies, are thin, quasi-two dimensional, rotationally supported disks. The majority of their stars orbit in the same plane in the same direction on low eccentricity orbits. The lion’s share of kinetic energy is invested in circular motion, with only small random motions, a condition described as dynamically cold. Examples of early and late type galaxies are shown in Fig. 1.

Fig. 1. Galaxy morphology. These examples shown an early type elliptical galaxy (NGC 3379, left), and two late type disk galaxies: a face-on spiral (NGC 628, top right), and an edge-on disk galaxy (NGC 891, bottom right). Elliptical galaxies are quasi-spherical, pressure supported stellar systems that tend to have predominantly old stellar populations, usually lacking young stars or much in the way of the cold interstellar gas from which they might form. In contrast, late type galaxies (spirals and irregulars) are thin, rotationally supported disks. They typically contain a mix of stellar ages and cold interstellar gas from which new stars continue to form. Interstellar dust is also present, being most obvious in the edge-on case. Images from Palomar Observatory, Caltech.

Finer distinctions in morphology can be made within the broad classes of early and late type galaxies, but the basic structural and kinematic differences suffice here. The disordered motion of ETGs is a natural consequence of violent relaxation (Lynden-Bell, 1967) in which a stellar system reaches a state of dynamical equilibrium from a chaotic initial state. This can proceed relatively quickly from a number of conceivable initial conditions, and is a rather natural consequence of the hierarchical merging of sub-clumps expected from the Gaussian initial conditions indicated by observations of the CMB (White, 1996). In contrast, the orderly rotation of dynamically cold LTGs requires a gentle settling of gas into a rotationally supported disk. It is essential that disk formation occur in the gaseous phase, as gas can dissipate and settle to the preferred plane specified by the net angular momentum of the system. Once stars form, their orbits retain a memory of their initial state for a period typically much greater than the age of the universe (Binney & Tremaine, 1987). Consequently, the bulk of the stars in the spiral disk must have formed there after the gas settled.

In addition to the dichotomy in structure, ETGs and LTGs also differ in their evolutionary history. ETGs tend to be ‘red and dead,’ which is to say, dominated by old stars. They typically lack much in the way of recent star formation, and are often devoid of the cold interstellar gas from which new stars can form. Most of their star formation happened in the early universe, and may have involved the merger of multiple protogalactic fragments. Irrespective of these details, massive ETGs appeared early in the universe (Steinhardt et al., 2016), and for the most part seem to have evolved passively since (Franck and McGaugh, 2017).

Again in contrast, LTGs have on-going star formation in interstellar media replete with cold atomic and molecular gas. They exhibit a wide range in stellar ages, from newly formed stars to ancient stars dating to near the beginning of time. Old stars seem to be omnipresent, famously occupying globular clusters but also present in the general disk population. This implies that the gaseous disk settled fairly early, though accretion may continue over a long timescale (van den Bergh, 1962; Henry and Worthey, 1999). Old stars persist in the same orbital plane as young stars (Binney & Merrifield, 1998), which precludes much subsequent merger activity, as the chaos of merging distorts orbits. Disks can be over-heated (Toth and Ostriker, 1992) and transformed by interactions between galaxies (Toomre and Toomre, 1972), even turning into elliptical galaxies during major mergers (Barnes & Hernquist, 1992).

Aside from its morphology, an obvious property of a galaxy is its mass. Galaxies exist over a large range of mass, with a type-dependent characteristic stellar mass of 5 ​× ​1010 ​M for disk dominated systems (the Milky Way is very close to this mass: Bland-Hawthorn & Gerhard, 2016) and 1011 ​M for elliptical galaxies (Moffett et al., 2016). Above this characteristic mass, the number density of galaxies declines sharply, though individual galaxies exceeding a few 1011 ​M certainly exist. The number density of galaxies increases gradually to lower masses, with no known minimum. The gradual increase in numbers does not compensate for the decrease in mass: integrating over the distribution, one finds that most of the stellar mass is in bright galaxies close to the characteristic mass.

Galaxies have a characteristic size and surface brightness. The same amount of stellar mass can be concentrated in a high surface brightness (HSB) galaxies, or spread over a much larger area in a low surface brightness (LSB) galaxy. For the purposes of this discussion, it suffices to assume that the observed luminosity is proportional to the mass of stars that produces the light. Similarly, the surface brightness measures the surface density of stars. Of the three observable quantities of luminosity, size, and surface brightness, only two are independent: the luminosity is the product of the surface brightness and the area over which it extends. The area scales as the square of the linear size.

The distribution of size and mass of galaxies is shown in Fig. 2. This figure spans the range from tiny dwarf irregular galaxies containing ‘only’ a few hundred thousand stars to giant spirals composed of hundreds of billions of stars with half-light radii ranging from hundreds of parsecs to tens of kpc. The upper boundaries represent real, physical limits on the sizes and masses of galaxies. Bright objects are easy to see; if still higher mass galaxies were common, they would be readily detected and cataloged. In contrast, the lower boundaries are set by the limits of observational sensitivity (“selection effects”): galaxies that are physically small or low in surface brightness are difficult to detect and are systematically under-represented in galaxy catalogs (Allen & Shu, 1979; Disney, 1976; McGaugh et al., 1995a).

Fig. 2. Galaxy size and mass. The radius that contains half of the light is plotted against the stellar mass. Galaxies exist over many decades in mass, and exhibit a considerable variation in size at a given mass. Early and late type galaxies are demarcated with different symbols, as noted. Lines illustrate tracks of constant stellar surface density. The data for ETGs are from the compilation of Dabringhausen and Fellhauer (2016) augmented by dwarf Spheroidal (dSph) galaxies in the Local Group compiled by Lelli et al. (2017). Ultra-diffuse galaxies (UDGs: van Dokkum et al., 2015; Mihos et al., 2015, ​× ​and +, respectively) have unsettled kinematic classifications at present, but most seem likely to be pressure supported ETGs. The bulk of the data for LTGs is from the SPARC database (Lelli et al., 2016a), augmented by cases that are noteworthy for their extremity in mass or surface brightness (Brunker et al., 2019; Dalcanton, Spergel, Gunn, et al., 1997; de Blok et al., 1995; McGaugh and Bothun, 1994; Mihos et al., 2018; Rhode et al., 2013; Schombert et al., 2011). The gas content of these star-forming systems adds a third axis, illustrated crudely here by whether an LTG is made more of stars or gas (filled and open symbols, respectively).

Individual galaxies can be early type or late type, high mass or low mass, large or small in linear extent, high or low surface brightness, gas poor or gas rich. No one of these properties is completely predictive of the others: the correlations that do exist tend to have lots of intrinsic scatter. The primary exception to this appears to involve the kinematics. Massive galaxies are fast rotators; low mass galaxies are slow rotators. This Tully-Fisher relation (Tully and Fisher, 1977) is one of the strongest correlations in extragalactic astronomy (Lelli et al., 2016b). It is thus necessary to simultaneously explain both the chaotic diversity of galaxy properties and the orderly nature of their kinematics (McGaugh et al., 2019).

Galaxies do not exist in isolation. Rather than being randomly distributed throughout the universe, they tend to cluster together: the best place to find a galaxy is in the proximity of another galaxy (Rubin, 1954). A common way to quantify the clustering of galaxies is the two-point correlation function ξ(r) (Peebles, 1980). This measures the excess probability of finding a galaxy within a distance r of a reference galaxy relative to a random distribution. The observed correlation function is well approximated as a power law whose slope and normalization varies with galaxy population. ETGs are more clustered than LTGs, having a longer correlation length: r0 ​≈ ​9 Mpc for red galaxies vs. ~ 5 Mpc for blue galaxies (Zehavi et al., 2011). Here we will find this quantity to be of interest for comparing the distribution of high and low surface brightness galaxies.


Galaxies are sometimes called island universes. That is partly a hangover from pre-Hubble times during which it was widely believed that the Milky Way contained everything: it was one giant island universe embedded in an indefinite but otherwise empty void. We know that’s not true now – there are lots of stellar systems of similar size to the Milky Way – but they often seem to stand alone even if they are clustered in non-random ways.

For example, here is the spiral galaxy NGC 7757, an island unto itself.

NGC 7757 from the digitized sky survey (© 1994, Association of Universities for Research in Astronomy, Inc).

NGC 7757 is a high surface brightness spiral. It is easy to spot amongst the foreground stars of the Milky Way. In contrast, there are strong selection effects against low surface brightness galaxies, like UGC 1230:

UGC 1230 from the digitized sky survey (© 1994, Association of Universities for Research in Astronomy, Inc).

The LSB galaxy is rather harder to spot. Even when noticed, it doesn’t seem as important as the HSB galaxy. This, in a nutshell, is the history of selection effects in galaxy surveys, which are inevitably biased towards the biggest and the brightest. Advances in detectors (especially the CCD revolution of the 1980s) helped open our eyes to the existence of these LSB galaxies, and allowed us to measure their physical properties. Doing so provided a stringent test of galaxy formation theories, which have scrambled to catch up ever since.

What JWST will see

What JWST will see

Big galaxies at high redshift!

That’s my prediction, anyway. A little context first.

New Year, New Telescope

First, JWST finally launched. This has been a long-delayed NASA mission; the launch had been put off so many times it felt like a living example of Zeno’s paradox: ever closer but never quite there. A successful launch is always a relief – rockets do sometimes blow up on lift off – but there is still sweating to be done: it has one of the most complex deployments of any space mission. This is still a work in progress, but to start the new year, I thought it would be nice to look forward to what we hope to see.

JWST is a major space telescope optimized for observing in the near and mid-infrared. This enables observation of redshifted light from the earliest galaxies. This should enable us to see them as they would appear to our eyes had we been around at the time. And that time is long, long ago, in galaxies very far away: in principle, we should be able to see the first galaxies in their infancy, 13+ billion years ago. So what should we expect to see?

Early galaxies in LCDM

A theory is only as good as its prior. In LCDM, structure forms hierarchically: small objects emerge first, then merge into larger ones. It takes time to build up large galaxies like the Milky Way; the common estimate early on was that it would take at least a billion years to assemble an L* galaxy, and it could easily take longer. Ach, terminology: an L* galaxy is the characteristic luminosity of the Schechter function we commonly use to describe the number density of galaxies of various sizes. L* galaxies like the Milky Way are common, but the number of brighter galaxies falls precipitously. Bigger galaxies exist, but they are rare above this characteristic brightness, so L* is shorthand for a galaxy of typical brightness.

We expect galaxies to start small and slowly build up in size. This is a very basic prediction of LCDM. The hierarchical growth of dark matter halos is fundamental, and relatively easy to calculate. How this translates to the visible parts of galaxies is more fraught, depending on the details of baryonic infall, star formation, and the many kinds of feedback. [While I am a frequent critic of model feedback schemes implemented in hydrodynamic simulations on galactic scales, there is no doubt that feedback happens on the much smaller scales of individual stars and their nurseries. These are two very different things for which we confusingly use the same word since the former is the aspirational result of the latter.] That said, one only expects to assemble mass so fast, so the natural expectation is to see small galaxies first, with larger galaxies emerging slowly as their host dark matter halos merge together.

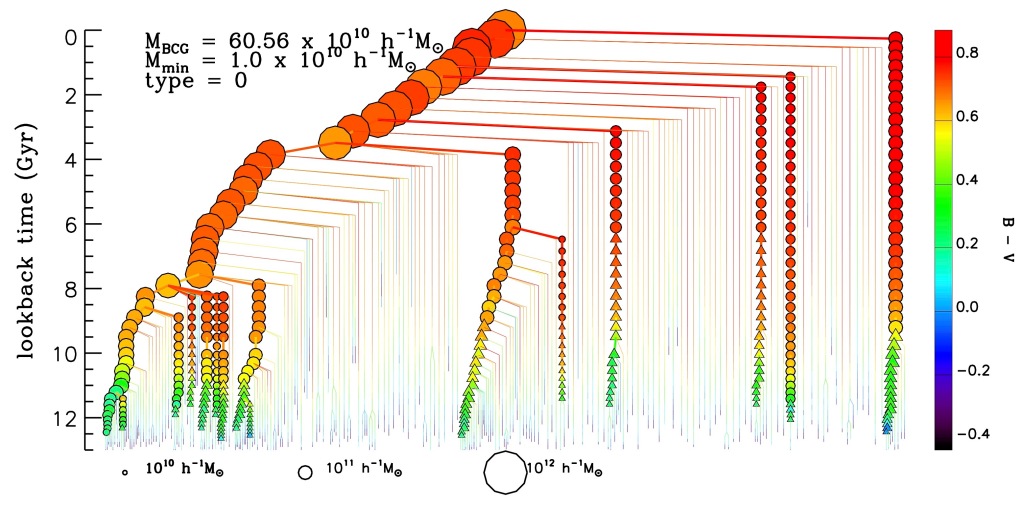
Here is an example of a model formation history that results in the brightest galaxy in a cluster (from De Lucia & Blaizot 2007). Little things merge to form bigger things (hence “hierarchical”). This happens a lot, and it isn’t really clear when you would say the main galaxy had formed. The final product (at lookback time zero, at redshift z=0) is a big galaxy composed of old stars – fairly typically for a giant elliptical. But the most massive progenitor is still rather small 8 billion years ago, over 4 billion years after the Big Bang. The final product doesn’t really emerge until the last major merger around 4 billion years ago. This is just one example in one model, and there are many different models, so your mileage will vary. But you get the idea: it takes a long time and a lot of mergers to assemble a big galaxy.

Brightest cluster galaxy merger tree. Time progresses upwards from early in the universe at bottom to the present day at top. Every line is a small galaxy that merges to ultimately form the larger galaxy. Symbols are color-coded by B−V color (red meaning old stars, blue young) and their area scales with the stellar mass (bigger circles being bigger galaxies. From De Lucia & Blaizot 2007).

It is important to note that in a hierarchical model, the age of a galaxy is not the same as the age of the stars that make up the galaxy. According to De Lucia & Blaizot, the stars of the brightest cluster galaxies

“are formed very early (50 per cent at z~5, 80 per cent at z~3)”

but do so

“in many small galaxies”

– i.e., the little progenitor circles in the plot above. The brightest cluster galaxies in their model build up rather slowly, such that

“half their final mass is typically locked-up in a single galaxy after z~0.5.”

De Lucia & Blaizot (2007)

So all the star formation happens early in the little things, but the final big thing emerges later – a lot later, only reaching half its current size when the universe is about 8 Gyr old. (That’s roughly when the solar system formed: we are late-comers to this party.) Given this prediction, one can imagine that JWST should see lots of small galaxies at high redshift, their early star formation popping off like firecrackers, but it shouldn’t see any big galaxies early on – not really at z > 3 and certainly not at z > 5.

Big galaxies in the data at early times?

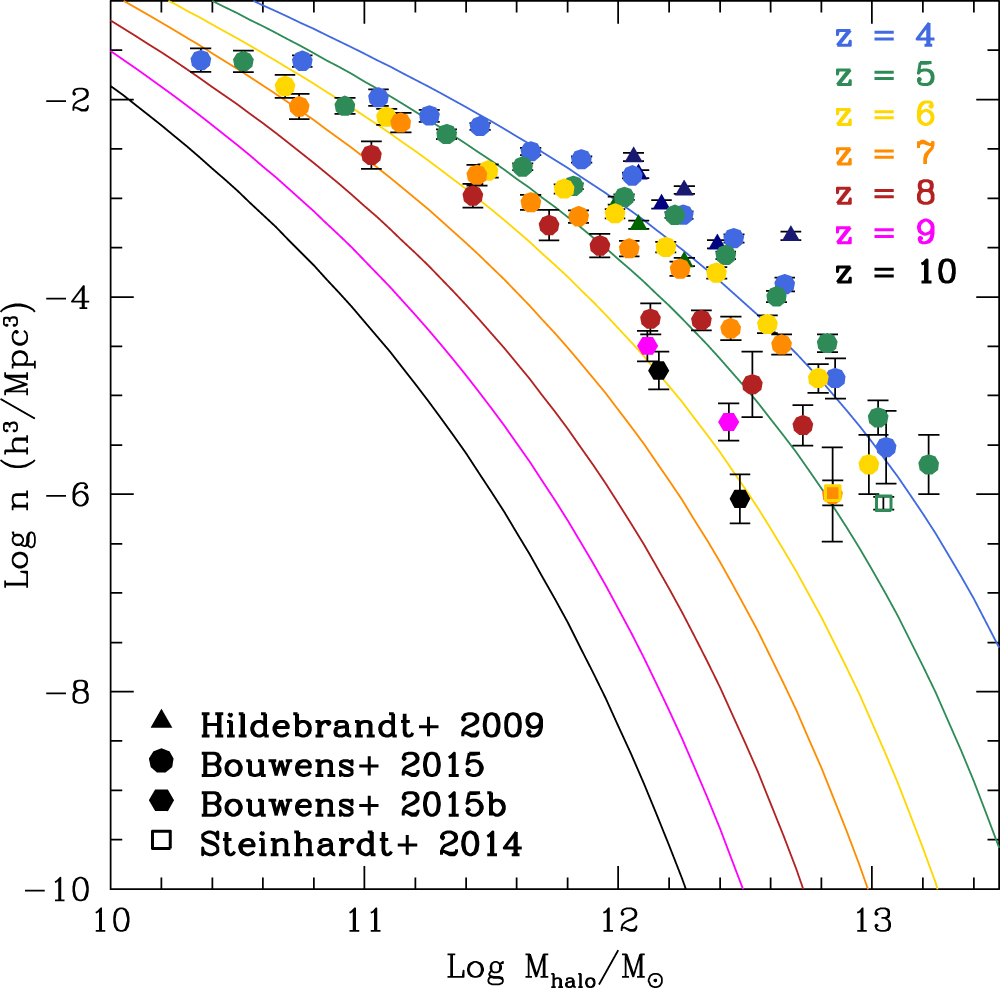
While JWST is eagerly awaited, people have not been idle about looking into this. There have been many deep surveys made with the Hubble Space Telescope, augmented by the infrared capable (and now sadly defunct) Spitzer Space Telescope. These have already spied a number of big galaxies at surprisingly high redshift. So surprising that Steinhardt et al. (2016) dubbed it “The Impossibly Early Galaxy Problem.” This is their key plot:

The observed (points) and predicted (lines) luminosity functions of galaxies at various redshifts (colors). If all were well, the points would follow the lines of the same color. Instead, galaxies appear to be brighter than expected, already big at the highest redshifts probed. From Steinhardt et al. (2016).

There are lots of caveats to this kind of work. Constructing the galaxy luminosity function is a challenging task at any redshift; getting it right at high redshift especially so. While what counts as “high” varies, I’d say everything on the above plot counts. Steinhardt et al. (2016) worry about these details at considerable length but don’t find any plausible way out.

Around the same time, one of our graduate students, Jay Franck, was looking into similar issues. One of the things he found was that not only were there big galaxies in place early on, but they were also in clusters (or at least protoclusters) early and often. That is to say, not only are the galaxies too big too soon, so are the clusters in which they reside.

Dr. Franck made his own comparison of data to models, using the Millennium simulation to devise an apples-to-apples comparison:

The apparent magnitude m* at 4.5 microns of L* galaxies in clusters as a function of redshift. Circles are data; squares represent the Millennium simulation. These diverge at z > 2: galaxies are brighter (smaller m*) than predicted (Fig. 5.5 from Franck 2017).

The result is that the data look more like big galaxies formed early already as big galaxies. The solid lines are “passive evolution” models in which all the stars form in a short period starting at z=10. This starting point is an arbitrary choice, but there is little cosmic time between z = 10 and 20 – just a few hundred million years, barely one spin around the Milky Way. This is a short time in stellar evolution, so is practically the same as starting right at the beginning of time. As Jay put it,

“High redshift cluster galaxies appear to be consistent with an old stellar population… they do not appear to be rapidly assembling stellar mass at these epochs.”

Franck 2017

We see old stars, but we don’t see the predicted assembly of galaxies via mergers, at least not at the expected time. Rather, it looks like some galaxies were already big very early on.

As someone who has worked mostly on well resolved, relatively nearby galaxies, all this makes me queasy. Jay, and many others, have worked desperately hard to squeeze knowledge from the faint smudges detected by first generation space telescopes. JWST should bring these into much better focus.

Early galaxies in MOND

To go back to the first line of this post, big galaxies at high redshift did not come as a surprise to me. It is what we expect in MOND.

Structure formation is generally considered a great success of LCDM. It is straightforward and robust to calculate on large scales in linear perturbation theory. Individual galaxies, on the other hand, are highly non-linear objects, making them hard to beasts to tame in a model. In MOND, it is the other way around – predicting the behavior of individual galaxies is straightforward – only the observed distribution of mass matters, not all the details of how it came to be that way – but what happens as structure forms in the early universe is highly non-linear.

The non-linearity of MOND makes it hard to work with computationally. It is also crucial to how structure forms. I provide here an outline of how I expect structure formation to proceed in MOND. This page is now old, even ancient in internet time, as the golden age for this work was 15 – 20 years ago, when all the essential predictions were made and I was naive enough to think cosmologists were amenable to reason. Since the horizon of scientific memory is shorter than that, I felt it necessary to review in 2015. That is now itself over the horizon, so with the launch of JWST, it seems appropriate to remind the community yet again that these predictions exist.

This 1998 paper by Bob Sanders is a foundational paper in this field (see also Sanders 2001 and the other references given on the structure formation page). He says, right in the abstract,

“Objects of galaxy mass are the first virialized objects to form (by z = 10), and larger structure develops rapidly.”

Sanders (1998)

This was a remarkable prediction to make in 1998. Galaxies, much less larger structures, were supposed to take much longer to form. It takes time to go from the small initial perturbations that we see in the CMB at z=1000 to large objects like galaxies. Indeed, the it takes at least a few hundred million years simply in free fall time to assemble a galaxy’s worth of mass, a hard limit. Here Sanders was saying that an L* galaxy might assemble as early as half a billion years after the Big Bang.

So how can this happen? Without dark matter to lend a helping hand, structure formation in the very early universe is inhibited by the radiation field. This inhibition is removed around z ~ 200; exactly when being very sensitive to the baryon density. At this point, the baryon perturbations suddenly find themselves deep in the MOND regime, and behave as if there is a huge amount of dark matter. Structure proceeds hierarchically, as it must, but on a highly compressed timescale. To distinguish it from LCDM hierarchical galaxy formation, let’s call it prompt structure formation. In prompt structure formation, we expect

  • Early reionization (z ~ 20)
  • Some L* galaxies by z ~ 10
  • Early emergence of the cosmic web
  • Massive clusters already at z > 2
  • Large, empty voids
  • Large peculiar velocities
  • A very large homogeneity scale, maybe fractal over 100s of Mpc

There are already indications of all of these things, nearly all of which were predicted in advance of the relevant observations. I could elaborate, but that is beyond the scope of this post. People should read the references* if they’re keen.

*Reading the science papers is mandatory for the pros, who often seem fond of making straw man arguments about what they imagine MOND might do without bothering to check. I once referred some self-styled experts in structure formation to Sanders’s work. They promptly replied “That would mean structures of 1018 M!” when what he said was

“The largest objects being virialized now would be clusters of galaxies with masses in excess of 1014 M. Superclusters would only now be reaching maximum expansion.”

Sanders (1998)

The exact numbers are very sensitive to cosmological parameters, as Sanders discussed, but I have no idea where the “experts” got 1018, other than just making stuff up. More importantly, Sanders’s statement clearly presaged the observation of very massive clusters at surprisingly high redshift and the discovery of the Laniakea Supercluster.

These are just the early predictions of prompt structure formation, made in the same spirit that enabled me to predict the second peak of the microwave background and the absorption signal observed by EDGES at cosmic dawn. Since that time, at least two additional schools of thought as to how MOND might impact cosmology have emerged. One of them is the sterile neutrino MOND cosmology suggested by Angus and being actively pursued by the Bonn-Prague research group. Very recently, there is of course the new relativistic theory of Skordis & Złośnik which fits the cosmologists’ holy grail of the power spectrum in both the CMB at z = 1090 and galaxies at z = 0. There should be an active exchange and debate between these approaches, with perhaps new ones emerging.

Instead, we lack critical mass. Most of the community remains entirely obsessed with pursuing the vain chimera of invisible mass. I fear that this will eventually prove to be one of the greatest wastes of brainpower (some of it my own) in the history of science. I can only hope I’m wrong, as many brilliant people seem likely to waste their career running garbage in-garbage out computer simulations or at the bottom of a mine shaft failing to detect what isn’t there.

A beautiful mess

JWST can’t answer all of these questions, but it will help enormously with galaxy formation, which is bound to be messy. It’s not like L* galaxies are going to spring fully formed from the void like Athena from the forehead of Zeus. The early universe must be a chaotic place, with clumps of gas condensing to form the first stars that irradiate the surrounding intergalactic gas with UV photons before detonating as the first supernovae, and the clumps of stars merging to form giant elliptical galaxies while elsewhere gas manages to pool and settle into the large disks of spiral galaxies. When all this happens, how it happens, and how big galaxies get how fast are all to be determined – but now accessible to direct observation thanks to JWST.

It’s going to be a confusing, beautiful mess, in the best possible way – one that promises to test and challenge our predictions and preconceptions about structure formation in the early universe.

A Stellar Population Mystery in a Low Surface Brightness Galaxy

A Stellar Population Mystery in a Low Surface Brightness Galaxy

“Galaxies are made of stars.”

Bob Schommer, quoted by Dave Silva in his dissertation on stellar populations

This tongue-in-cheek quote is a statement of the obvious, at least for the 90+ years since Hubble established that galaxies are stellar systems comparable to and distinct from the Milky Way. There’s interstellar gas and dust too, and I suppose for nearly half that time, people have also thought galaxies to be composed of dark matter. But you can’t see that; the defining characteristic of galaxies is the stars by whose amalgamated light they shine.

The spiral galaxy NGC 7757 (left) and a patch of adjacent sky (right). Both images are 1/4 degree on a side. Most of the sky looks like the patch at right, populated only by scattered stars. You know a galaxy when you see one. These images are based on photographic data obtained using the Oschin Schmidt Telescope on Palomar Mountain as part of the Palomar Observatory Sky Survey-II (POSS-II).

Stellar populations is the term astronomers use to describe the generations of stars that compose the galaxies we observe. The concept was introduced by Walter Baade in a 1944 paper in which he resolved individual stars in Andromeda and companion galaxies, aided by war time blackouts. He noted that some of the stars he resolved had color-magnitude diagrams (CMDs – see below) that resembled that of the solar neighborhood, while others were more like globular clusters. Thus was born Population I and Population II, the epitome of astronomical terminology.

More generally, one can imagine defining lots of populations by tracing groups of stars with a common origin in space and time to the event in which they formed. From this perspective, the Milky Way is the composite of all the star forming events that built it up. Each group has its own age, composition, and orbital properties, and it would be good to have a map that is more detailed than “Pop I” and “Pop II.” Many projects are working to map out these complex details, including ESA’s Gaia satellite, which is producing many spectacular and fundamental results, like the orbit and acceleration of the sun within the Milky Way.

A simple stellar population is a group of stars that all share the same composition and age: they were born of the same material at the same time. Even such a simple stellar population can be rather complicated, as stars form with a distribution of masses (the IMF, for Initial Mass Function) from tiny to massive. The lowest mass stars are those that just barely cross the threshold for igniting hydrogen fusion in their core, which occurs at about 7% of the mass of the sun. Still lower mass objects are called brown dwarfs, and were once considered a candidate for dark matter. Though they don’t shine from fusion like stars, brown dwarfs do glow with the residual heat of their formation through gravitational contraction, and we can now see that there are nowhere near enough of them to be the dark matter. At the opposite end of the mass spectrum, stars many tens of times the mass of the sun are known, with occasional specimens reaching upwards of 100 solar masses. These massive stars burn bright and exhaust their fuel quickly, exploding as supernovae after a few million years – a mere blink of the cosmic eye. By contrast, the lowest mass stars are so faint that they take practically forever to burn through their fuel, and are expected to continue to shine (albeit feebly) for many tens of Hubble times into the future. There is a strong and continuous relation between stellar mass and lifetime: the sun is expected to persist as-is for about 10 billion years (it is just shy of halfway through its “main sequence” lifetime). After a mundane life fusing hydrogen and helium as a main sequence star, the sun will swell into a red giant, becoming brighter and larger in radius (but not mass). This period is much shorter-lived, as are the complex sequence of events that follow it, ultimately leaving behind the naked core as an earth-sized but roughly half solar mass white dwarf remnant.

Matters become more complicated when we consider galaxies composed of multiple generations and different compositions. Nevertheless, we understand well enough the evolution of individual stars – a triumph of twentieth century astronomy – to consider the complex stellar populations of external galaxies. A particular interest of mine are the stellar populations of low surface brightness galaxies. These are late morphological types (often but not always irregular galaxies) that tend to be gas rich and very blue. This requires many young stars, but also implies a low metallicity. This much can be inferred from unresolved observations of galaxies, but the effects of age and composition are often degenerate. The best way to sort this out is to do as Baade did and resolve galaxies into individual stars. This was basically impossible for all but the nearest galaxies before the launch of the Hubble Space Telescope. The resolution of HST allows us to see farther out and deeper into the color-magnitude diagrams of external galaxies.

The low surface brightness galaxy F575-3, as discovered on a POSS-II sky survey plate (left) and as seen by HST (right). Both images are negatives. Only a tiny fraction of the 6.6 degree square POSS-II plate is shown as the image at left covers a mere 1/13 degree on a side. The pink outline shows the still smaller area of sky observed by HST, which visited the object at different roll angles: the differing orientation of the satellite causes the slight twist in the rectangular shape that is imaged. HST resolves individual stars, allowing construction of a color-magnitude diagram. It also resolves background galaxies, which are the majority of the extended objects in this image. Some even shine right through the foreground LSB galaxy!

Collaborator Jim Schombert has long been a leader in studying low surface brightness galaxies, discovering many examples of the class, and leading their study with HST among many stellar contributions. He is one of the unsung heroes without whom the field would be nowhere near where it is today. This post discusses a big puzzle he has identified in the stellar populations of low surface brightness galaxies: the case of the stars with inexplicable[?] IR excesses. Perhaps he has also solved this puzzle, but first we have to understand what is normal and what is weird in a galaxy’s stellar population.

When we resolve a galaxy into stars in more than one filter, the first thing we do is plot a color-magnitude diagram (CMD). The CMD quantifies how bright a star is, and what its color is – a proxy for its surface temperature. Hot stars are blue; cooler ones are red. The CMD is the primary tool by which the evolution of stars was unraveled. Normal features of the CMD include the main sequence (where stars spend the majority of their lives) and the red giant branch (prominent since giant stars are bright if rare). This is what Baade recognized in Populations I and II – stars with CMDs like those near the sun (lots of main sequence stars and some red giants) and those like globular clusters (mostly red giants at bright magnitudes and fainter main sequence stars).

In actively star forming galaxies like F415-3 below, there are plenty of young, massive, bright stars. These evolve rapidly, traipsing across the CMD from blue to red and back to blue and then red again. We can use what we know about stellar evolution to deduce the star formation history of a galaxy – how many stars formed as a function of time. This works quite well for short time periods as massive stars evolve fast and are easy to see, but it becomes increasingly hard for older stars. A galaxy boasts about its age when it is young but becomes less forthcoming as it gets older.

Color-magnitude diagram (CMD) of the low surface brightness galaxy F415-3 observed by HST (Schombert & McGaugh 2015). Each point is one star. The x-axis is color, with bluer stars to the left and redder stars to the right. The y-axis is magnitude: brighter stars are higher; fainter stars are lower. There are many, many stars fainter than those detected here; these observations only resolve the brightest stars that populate the top of the CMD. The lines demarcate the CMD into regions dominated by stars in various evolutionary phases. Counting stars in each box lets us trace out the recent star formation history, which is found to vary stochastically over the past few tens of millions of years while remaining roughly constant when averaged over the age of the universe (13+ billion years).

Most late type, irregular galaxies have been perking along, forming stars at a modest but fairly steady rate for most of the history of the universe. That’s a very broad-brush statement; there are many puzzling details in the details. F415-3 seems to be deficient in AGB stars. These are asymptotic giants, the phase of evolution after the phase after the first-ascent red giant branch. This may be challenging the limits of our understanding of the modeling of stellar evolution. The basics are well-understood, but stars are giant, complicated, multifaceted beasts: just as understanding that terrestrial planets are basically metallic cores surrounded by mantles of rocky minerals falls short of describing the Earth, so too does a basic understanding of stellar evolution fall short of explaining every detail of every star. That’s what I love about astronomy: there is always something new to learn.

Below is the CMD of F575-3, now in the near infrared filters available on HST rather than the optical filters above. There is not such a rich recent star formation history in this case; indeed, this galaxy has been abnormally quiescent for its class. There are some young stars above the tip of the red giant branch (the horizontal blue line), but no HII regions of ionized gas that point up the hottest, youngest stars (typically < 10 Myr old). Mostly we see a red giant branch (the region dark with points below the line) and some main sequence stars (the cloud of points to the left of the red giant branch). These merge into a large blob at faint magnitudes as the uncertainties smear everything together at the limits of the observation.

Color-magnitude diagram of the stars in F575-3 observed by HST (left) and the surrounding field (right). The typical size of the error bars is shown in the right panel; this causes the data to smear into a blob at fainter magnitudes. One can nevertheless recognize some of the main features, as noted: the main sequence of young stars, the red giant branch below the horizontal line, and a region of rapidly evolving stars above the line (mostly asymptotic giants with some helium burning stars and a few red supergiants). There are also a number of stars to the right of the giant branch, in a region of the CMD that is not explained by models of stellar evolution. There shouldn’t be any stars here, but there are more than can be explained by background contamination. What are they?

One cool thing about F575-3 is that it has the bluest red giants known. All red giants are red, but just how red depends sensitively on their metallicity – the fraction of their composition that isn’t hydrogen or helium. As stars evolve, they synthesize heavy elements that are incorporated into subsequent generations of stars. After a while, you have a comparatively metal-rich composition like that of the sun – which is still not much: the mass of the elements in the sun that are not hydrogen or helium is less than 2% of the total. I know that sounds like a small fraction – it is a small fraction – but it is still rather a lot by the standards of the universe in which we live, which started as three parts hydrogen and one part helium, and nothing heavier than lithium. Stars have had to work hard for generation upon generation to make everything else in the periodic table from carbon on up. Galaxies smaller than the Milky Way haven’t got as far along in this process, so dwarf galaxies are typically low metallicity – often much less than 1% by mass.

F575-3 is especially low metallicity. Or so it appears from the color of its red giant stars. These are the bluest reds currently known. Here are some other dwarfs for comparison, organized in order of increasing metallicity. The right edge of the red giant branch in F575-3 is clearly to the left of everything else.

Color-magnitude diagrams of some of the dwarf galaxies that have been observed by HST. Colored lines illustrate the sequence expected for red giants of different metallicities. These are all well below the solar composition, as measured by the logarithmic ratio of the iron abundance relative to hydrogen relative to that in the sun: solar [Fe/H] = 0; [Fe/H] = -1 is one tenth of the solar metal abundance. The lines illustrate the locations of giant branches with [Fe/H] = -2.3 (blue), -1.5 (green) and -0.7 (red). That’s 0.5%, 3%, and 20% of solar, respectively. Heavy elements make up less than 0.4% of the mass of the stars in these galaxies.

But that’s not what I wrote to tell you about. I already knew LSB galaxies were low metallicity; that’s what I did part of my thesis on. That was based on the gas phase abundances, but it makes sense that the stars would share this property – they form out of the interstellar gas, after all. Somebody has to be the bluest of them all. That’s remarkable, but not surprising.

What is surprising is that F575-3 has an excess of stars with an IR-excess – their colors are too red in the infrared part of the spectrum. These are the stars to the right of the red giant branch. We found it basically impossible to populate this portion of the CMD without completely overdoing it. Plausible stellar evolution tracks don’t go there. Nature has no menu option for a sprinkling of high metallicity giant stars but hold the metals everywhere else: once you make those metals, there are ample numbers of high metallicity stars. So what the heck are these things with a near-IR excess?

The CMD of F575-3 in near-IR (left) and optical colors (right). Main sequence stars are blue, rapidly evolving phases like asymptotic giants are red, and most of the black points are red giant stars. There is a population of mystery stars colored purple. These have a near-IR excess: very red colors in the infrared, but normal colors in the optical.

My first thought was that they were bogus. There are always goofy things in astronomical data; outliers are often defects of some sort – in the detector, or the result of cosmic ray strikes. So initially they were easy to ignore. However, this kept nagging at us; it seemed like too much to just dismiss. There are some things like this in the background, but not enough to explain how many we see in the body of the diagram. This argued against things not associated with the galaxy itself, like background galaxies with redshifted colors. When we plotted the distribution of near-IR excess objects, they were clearly associated with the galaxy.

The distribution of sources with a near-IR excess (red) compared to objects of similar apparent magnitude. They’re in the same place as the galaxy that the eye sees in the raw image. Whatever they are, they’re clearly part of F575-3.

The colors make no sense for stars. They aren’t the occasional high metallicity red giant. So our next thought was extinction by interstellar dust. This has the net effect of making things look redder. But Jim did the hard work of matching up individual stars in both the optical and near-IR filters. The optical colors are normal. The population that stands out in the near-IR CMD mixes in evenly with the rest of the stars in the optical CMD. That’s the opposite of what dust does. Dust affects the optical colors more strongly. Here the optical colors are normal, but the near-IR colors are too red – hence an IR-excess.

There, I was stumped. We had convinced ourselves that we couldn’t just dismiss the IR-excess population as artifacts. They had the right spatial distribution to be part of the galaxy. They had the right magnitudes to be stars in the galaxy. But that had really weird IR colors that were unexplained by any plausible track of stellar evolution.

Important detail: stellar evolution models track what happens in the star, up to its surface, but not in the environment beyond. Jim thought about it, and came back to me with an idea outside my purview. He remembered a conversation he had had long ago with Karl Rakos while observing high redshift clusters with custom-tailored filters. Rakos had previously worked on Ap and Be stars – peculiar stars. I had heard of these things, but they’re rare and don’t contribute significantly to the integrated light of the stellar population in a galaxy like the Milky Way. They seemed like an oddity of little consequence in a big universe.

Be stars – that’s “B” then “e” for B-type stars (the second hottest spectral classification) with emission lines (hence the e). Stars mostly just have absorption lines; emission lines make them peculiar. But Jim learned from his conversations with Rakos that these stars also frequently had IR-excesses. Some digging into the literature, and sure enough, these types of stars have the right magnitudes and colors to explain the strange population we can’t otherwise understand.

It is still weird. There are a lot of them. Not a lot in an absolute sense, but a lot more than we’d expect from their frequency in the Milky Way. But now that we know to look for them, you can see a similar population in the some other dwarfs. Maybe they become more frequent in lower metallicity galaxies. The emission lines and the IR excess come from a disk of hot gas around the star; maybe such disks are more likely to form when there are fewer metals. This makes at least a tiny amount of sense, as B stars have a lot of energy to emit and angular momentum to transport. The mechanisms by which that can happen multiply when there are metals to make dust grains that can absorb and reprocess the abundance of UV photons. In their absence, when the metallicity is low, nature has to find another way. So maybe – maybe – Be stars are more common in lower metallicity environments because the dearth of dust encourages the formation of gas disks. That’s entirely speculative (a fun but dangerous aspect of astronomy), so maybe not.

I don’t know if ultimately Be stars are the correct interpretation. It’s the best we’ve come up with. I really don’t know whether metallicity and dust play the role I just speculatively described. But it is a new and unexpected thing – and that’s the cool thing about the never-ending discovery space of astronomy. Even when you know what to expect, the universe can still surprise you – if you pay attention to the data.

Tracing the baryons in star forming galaxies

Tracing the baryons in star forming galaxies

Galaxies are big. Our own Milky Way contains about fifty billion solar masses of stars, and another ten billion of interstellar gas, roughly speaking. The average star is maybe half a solar mass, so crudely speaking, that’s one hundred billion stars. Give or take. For comparison, the population of the Earth has not quite reached eight billion humans. So if you gave each one of us our own personal starship, in order to visit every star in the Galaxy, each one of us would have to visit a dozen stars. Give or take. I’m getting old, so I call dibs on Proxima Centauri through Procyon.

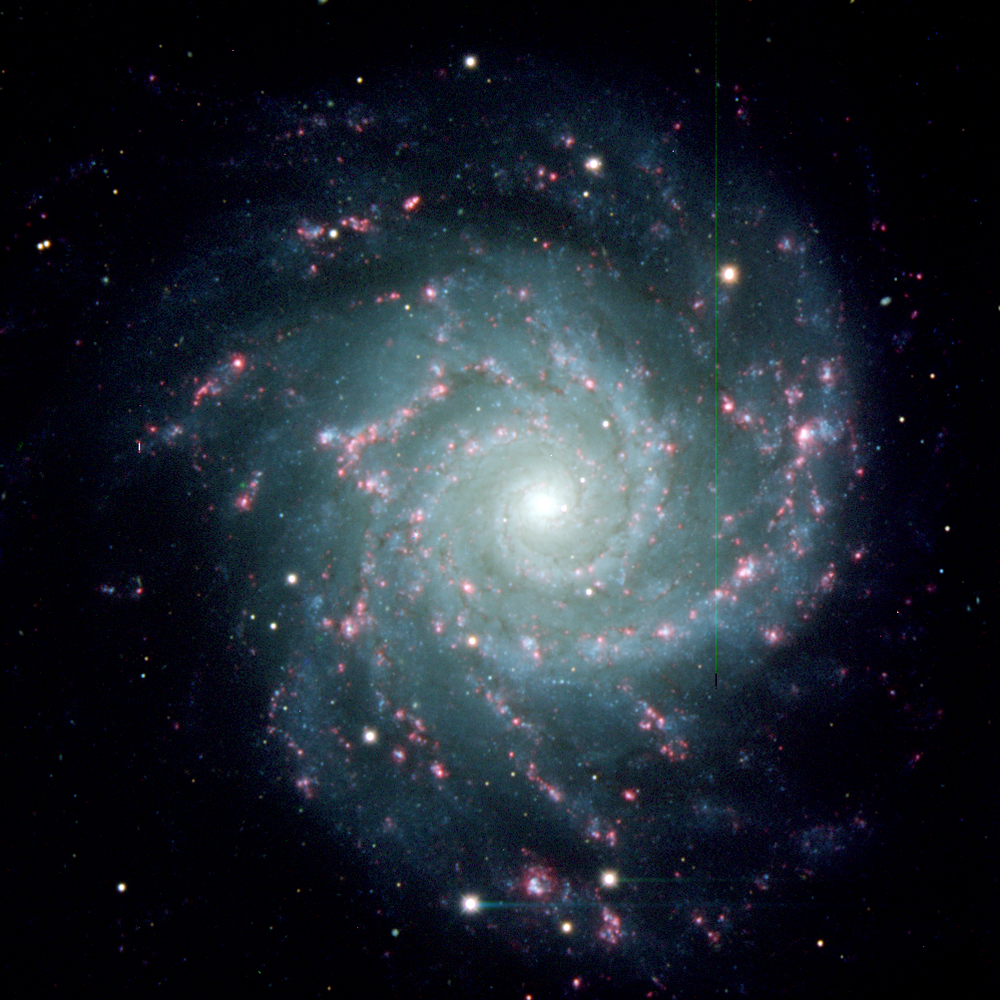
Figure 1 shows a picture of NGC 628, a relatively nearby spiral galaxy. What you see here is mostly stars, along with some interstellar dust and ionized gas. In addition to those components, there are also stellar remnants left behind by dead stars (mostly white dwarfs, some neutron stars, and the occasional black hole). In the space between the stars resides colder forms of interstellar gas, including both atomic gas (individual atoms in space) and molecular gas (the cold, dense material from which new stars form). How much is there of each component?

ngc628_final
Fig 1. The spiral galaxy NGC 628. The continuum light of stars in contrasted by dark dust lanes and highlighted by pink pinpoints of Balmer line emission. These are regions of interstellar gas illuminated by the UV emission of short-lived, massive O stars. Not visible here is the interstellar atomic and molecular gas from which stars form.

The bulk of the normal mass (excluding dark matter) in big spiral galaxies like the Milky Way is stars and their remnants. But there is also diffuse material in the vast interstellar medium – the ample space between the stars. This includes dust and several distinct phases of gas – molecular, atomic, and ionized (plasma). The dust and plasma are easy to see, but don’t add up to much – a mere millions of solar masses each for the whole Milky Way. The atomic and molecular gas add up to a lot more, but cannot be seen optically.

Atomic gas can be traced by 21 cm emission from the spin-flip transition of atomic hydrogen using radio telescopes. This is commonly referred to with the spectroscopic notation “HI”. The HI mass – the mass of atomic hydrogen – is usually the second largest mass component in spirals, after stars. In dwarf galaxies, the atomic gas often outweighs the stars (Fig. 2).

MgMst
Fig 2. Gas mass vs. stellar mass for galaxies in the SPARC database (blue) and an independent sample selected from SDSS (grey) by Bradford. The line is the line of equality where gas mass and stellar mass are equal. The red point is the Milky Way. Like other bright spirals, it is more stars than gas. Among lower mass dwarf galaxies, the reverse is commonly true: those in the field have more gas than stars.

Stars and atomic (HI) gas are the big two. When it comes to star forming galaxies, more massive spirals are usually star dominated while less massive dwarfs are usually dominated by atomic gas. But what about molecular gas?

Molecular gas is important to the star formation process. It is the densest (a very relative term!) material in the interstellar medium, the place where cold gas can condense into the nuggets that sometimes form stars. How much of this necessary ingredient is there?

The bulk of the mass of molecular gas is in molecular hydrogen, H2. Spectroscopically, H2 is a really boring molecule. It has no transitions in wavelength regimes that are readily accessible to observation. So, unlike atomic hydrogen, which brazenly announces its presence throughout the universe via the 21 cm line, molecular hydrogen is nigh-on invisible.

So we use proxies. The most commonly employed proxy for tracing molecular gas mass is carbon monoxide. CO is one of many molecules that accompany the much more abundance molecular hydrogen, and CO produces emission features that are more readily accessible observationally in the mm wavelength range. That has made it the tracer of choice.

CO is far from an ideal tracer of mass. Carbon and oxygen are both trace elements compared to hydrogen, so the correspondence between CO emission and molecular gas mass depends on the relative abundance of both. If that sounds dodgy, it gets worse. It also depends on the interstellar radiation field, the opacity thereto (molecular gas is inevitably associated with dense clumps of dust that shield it from the ambient radiation), and the spatial overlap of the two components – CO and H2 thrive in similar but not identical regions of space. Hence, converting the observed intensity of CO into a molecular hydrogen mass is a highly sensitive procedure that we typically bypass by assuming it is a universal constant.

It’s astronomy. We do what we can.

People have obsessed long and hard about the CO-to-H2 conversion, so we do have a reasonable idea what it is. While many debates can be had over the details, we have a decent idea of what the molecular gas mass is in some galaxies, at least to a first approximation. Molecular gas is usually outweighed by atomic gas, but sometimes it is comparable. So we’d like to keep track of it for the mass budget.

LCOMHIMst
Fig 3. The mass in molecular hydrogen gas as a function of atomic hydrogen (left) and stellar mass (right) from xGASS. The dotted line is the line of equality; molecular gas is usually outweighed by both atomic gas and stars. The red line at right is where the molecular gas mass is 7% of the stellar mass.

Obtaining CO observations is expensive, and often impossible: there are a lot of star forming galaxies where it simply isn’t detected. So we presume there is molecular gas there – that’s where the stars form, but we can’t always see it. So it would be handy to have another proxy besides CO.

Atomic gas is a lousy proxy for molecular gas. The mass of one hardly correlates with the other (Fig. 3). The two phases coexist in a complex and ever-changing variable quasi-equilibrium, with the amount of each at any given moment subject to change so that a snapshot of many galaxies provides a big mess.

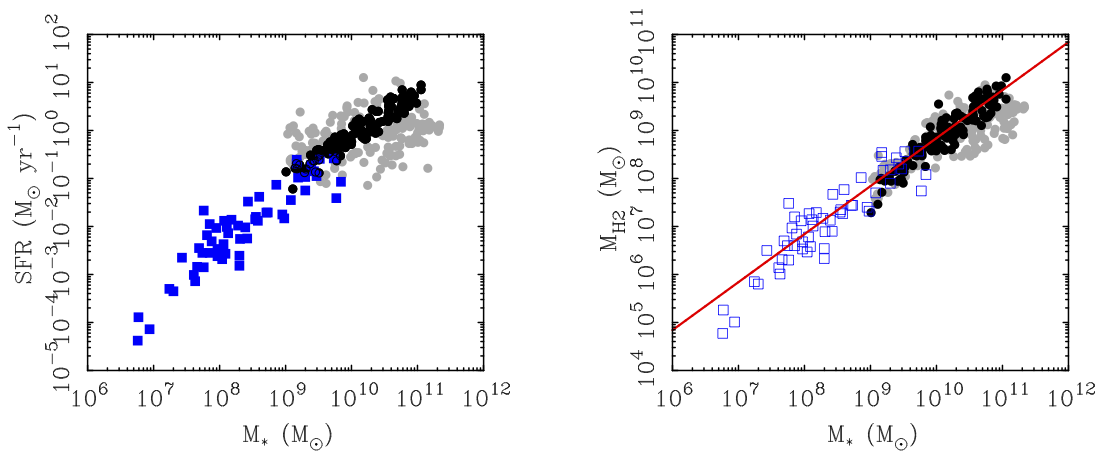
Fortunately, the molecular gas mass correlates better with other properties – notably star formation. This makes sense, because stars form from molecular gas. So in some appropriately averaged sense, one follows the other. Star formation can be traced in a variety of ways, like the Balmer emission in Fig. 1. We can see the stars forming and infer the amount of molecular gas required to fuel that star formation even if we can’t detect the gas directly (Fig. 4).

MH2SFRMst
Fig 4. The current star formation rate (left) and molecular gas mass (right) as a function of stellar mass. The grey and black points are from xGASS, with the black points being those where the current star formation rate is within a factor of two of the past average (i.e., the stellar mass divided by the age of the universe). Blue points are low surface brightness galaxies. These extend the relation at left to much lower mass, but are generally not detected in CO. The molecular gas at right (open squares) is inferred by the amount required to sustain the observed star formation.

I’ve done a lot of work on low surface brightness galaxies, a class of objects that have proven particularly difficult to detect in CO. They have low dust contents, low oxygen abundances, relatively hard interstellar radiation fields – all factors that mitigate against CO. Yet we do see them forming stars, sometimes just one O star at a time, and we know how much molecular gas it takes to do that. So we can use star formation as a proxy for molecular gas mass. This is probably no worse than using CO, and perhaps even better – or would be, if we didn’t have to rely on CO to calibrate it in the first place.

Accurate tracers of star formation are also somewhat expensive to obtain. There are situations in which we need an estimate for the molecular gas mass where we don’t have either CO or a measurement of the star formation rate. So… we need a proxy for the proxy. Fortunately, that is provided by the stellar mass.

The stellar mass of a star-forming galaxy correlates with both its molecular gas mass and its star formation rate (Figs. 3 and 4). This is not surprising. It takes molecules to form stars, and it takes star formation to build up stellar mass. Indeed, the stellar mass is the time-integral of the star formation rate, so a correlation between the two (as seen in the left panel of Fig. 4) is mathematically guaranteed.

This brings us to the seven percent solution. Going through all the calibration steps, the molecular gas mass is, on average, about 7% of the stellar mass (the red lines in Figs. 3 and 4). The uncertainties in this are considerable. I’ve tried to work this out previously, and typically came up with numbers in the 5 – 10% range. So it seems to be in there somewhere.

This is adequate for some purposes, but not for others. One thing I want it for is to keep track of the total mass budget of baryons in galaxies so that we can calibrate the Baryonic Tully-Fisher relation. For this purpose it is adequate since molecular gas ranks behind both stars and atomic gas in the mass budget of almost every rotating galaxy. If it is 5% or 10% instead of 7%, this is a difference of a few percent of something that is itself typically < 10% of the total, and often less. A few percent of a few percent is a good working definition of negligible – especially in astronomy.

On top of all that, we also have to keep track of the stuff that isn’t hydrogen – helium and everything else in the periodic table, which astronomers often refer to collectively as “metals.” This makes for all sorts of partially-deserved jokes – oxygen isn’t a metal! but it is number 3 in cosmic abundance after hydrogen and helium. Like many anachronisms, the practice has good historical precedent. Early efforts to measure the abundances of the chemical elements in stars first gave results for iron. As other elements were probed, their abundances followed a pattern that scaled pretty well with the abundance of iron relative to hydrogen. So once again we have a proxy – this time, the iron abundance being a stand-in for that of everything else. Hence the persistence of the terminology – the metallicity of a star is a shorthand for the fraction of its mass that is not hydrogen and helium.

And that fraction is small. We usually write the mass fractions of hydrogen, helium, and everything else (metals) as

X + Y + Z = 1

where X is the fraction of mass in hydrogen, Y that in helium, and Z is everything else. For the sun, Lodders gives X = 0.7389, Y = 0.2463, and Z = 0.0148. Do I believe all those significant digits? No. Is there a good reason for them to be there? Yes. So without delving into those details, let’s just note that the universe is about 3 parts hydrogen, one part helium, with a sprinkling of everything else. Everything else being all the elements in the periodic table that aren’t hydrogen or helium – all the carbon and nitrogen and oxygen and silicon and magnesium and noble gases and actual metals – these all add up to about 1.5% of the mass of the sun, which is typical of nearby stars. So you can see why they’re all just metals to many astronomers.

For the mass of gas in galaxies, we need to correct what we measure in hydrogen for the presence of helium and metals. We measure the mass of atomic hydrogen using the 21 cm line, but that’s just the hydrogen. There is a corresponding amount of helium and metals that goes along with it. So we estimate the mass fraction in hydrogen, X, and use divide by that to get the total mass: Mgas = MHI/X. We do the same for molecular gas, etc.

There are measurements of the metallicities of entire galaxies, but – you guessed it – this isn’t observationally cheap, and isn’t always available. So we need another proxy. Luckily for us, it turns out that once again there is a pretty good correlation of metallicity with stellar mass: galaxies with lots of stars have made lots of supernovae that have processed lots of material into metals. Most of it is still hydrogen, so this is a very subtle effect: 1/X = 1.34 for the tiniest dwarf, going up to about 1.4 for a galaxy like the Milky Way. Still, we know this happens, so we can account for it, at least in a statistical way.

For those who are curious about the details, or want the actual formulae to use, please refer to this AAS research note. Next time, I hope to discuss an application for all this.

The Star Forming Main Sequence – Dwarf Style

The Star Forming Main Sequence – Dwarf Style

A subject of long-standing interest in extragalactic astronomy is how stars form in galaxies. Some galaxies are “red and dead” – most of their stars formed long ago, and have evolved as stars will: the massive stars live bright but short lives, leaving the less massive ones to linger longer, producing relatively little light until they swell up to become red giants as they too near the end of their lives. Other galaxies, including our own Milky Way, made some stars in the ancient past and are still actively forming stars today. So what’s the difference?

The difference between star forming galaxies and those that are red and dead turns out to be both simple and complicated. For one, star forming galaxies have a supply of cold gas in their interstellar media, the fuel from which stars form. Dead galaxies have very little in the way of cold gas. So that’s simple: star forming galaxies have the fuel to make stars, dead galaxies don’t. But why that difference? That’s a more complicated question I’m not going to begin to touch in this post.

One can see current star formation in galaxies in a variety of ways. These usually relate to the ultraviolet (UV) photons produced by short-lived stars. Only O stars are hot enough to produce the ionizing radiation that powers the emission of HII (pronounced `H-two’) regions – regions of ionized gas that are like cosmic neon lights. O stars power HII regions but live less than 10 million years. That’s a blink of the eye on the cosmic timescale, so if you see HII regions, you know stars have formed recently enough that the short-lived O stars are still around.

f549_1_small
The dwarf LSB galaxy F549-1 and companion. The pink knots are HII regions detected in the light of H-alpha, the first emission line in the Balmer sequence of hydrogen. HII regions are ionized by short-lived O-stars, serving as cosmic shingles that shout “Hey! We’re forming stars here!”

Measuring the intensity of the Hα Balmer line emission provides a proxy for the number of UV photons that ionize the gas, which in turn basically counts the number of O stars that produce the ionizing radiation. This number, divided by the short life-spans of O stars, measures the current star formation rate (SFR).

There are many uncertainties in the calibration of this SFR: how many UV photons do O stars emit? Over what time span? How many of these ionizing photons are converted into Hα, and how many are absorbed by dust or manage to escape into intergalactic space? For every O star that comes and goes, how many smaller stars are born along with it? This latter question is especially pernicious, as most stellar mass resides in small stars. The O stars are only the tip of the iceberg; we are using the tip to extrapolate the size of the entire iceberg.

Astronomers have obsessed over these and related questions for a long time. See, for example, the review by Kennicutt & Evans. Suffice it to say we have a surprisingly decent handle on it, and yet the systematic uncertainties remain substantial. Different methods give the same answer to within an order of magnitude, but often differ by a factor of a few. The difference is often in the mass spectrum of stars that is assumed, but even rationalizing that to the same scale, the same data can be interpreted to give different answers, based on how much UV we estimate to be absorbed by dust.

In addition to the current SFR, one can also measure the stellar mass. This follows from the total luminosity measured from starlight. Many of the same concerns apply, but are somewhat less severe because more of the iceberg is being measured. For a long time we weren’t sure we could do better than a factor of two, but this work has advanced to the point where the integrated stellar masses of galaxies can be estimated to ~20% accuracy.

A diagram that has become popular in the last decade or so is the so-called star forming main sequence. This name is made in analogy with the main sequence of stars, the physics of which is well understood. Whether this is an appropriate analogy is debatable, but the terminology seems to have stuck. In the case of galaxies, the main sequence of star forming galaxies is a plot of star formation rate against stellar mass.

The star forming main sequence is shown in the graph below. It is constructed from data from the SINGS survey (red points) and our own work on dwarf low surface brightness (LSB) galaxies (blue points). Each point represents one galaxy. Its stellar mass is determined by adding up the light emitted by all the stars, while the SFR is estimated from the Hα emission that traces the ionizing UV radiation of the O stars.

SFMSannotated.001
The star formation rate measured as a function of stellar mass for star forming galaxies, the “star forming main sequence” (from McGaugh, Schombert, & Lelli 2017). Each point represents one galaxy. Star formation is rapid in the most luminous spirals, which contain tens of thousands of O stars. In contrast, some dwarf galaxies contain only a single HII region that is so faint that it may be ionized by a single O star.

The data show a nice correlation, albeit with plenty of intrinsic scatter. This is hardly surprising, as the two axes are not physically independent. They are measuring different quantities that trace the same underlying property: star formation over different time scales. The y-axis is a measure of the quasi-instantaneous star formation rate; the x-axis is the SFR integrated over the age of the galaxy.

Since the stellar mass is the time integral of the SFR, one expects the slope of the star forming main sequence (SFMS) to be one. This is illustrated by the diagonal line marked “Hubble time.” A galaxy forming stars at a constant rate for the age of the universe will fall on this line.

The data for LSB galaxies scatter about a line with slope unity. The best-fit line has a normalization a bit less than that of a constant SFR for a Hubble time. This might mean that the galaxies are somewhat younger than the universe (a little must be true, but need not be much), have a slowly declining SFR (an exponential decline with an e-folding time of a Hubble time works well), or it could just be an error in the calibration of one or both axes. The systematic errors discussed above are easily large enough to account for the difference.

To first order, the SFR in LSB galaxies is constant when averaged over billions of years. On the millions of years timescale appropriate to O stars, the instantaneous SFR bounces up and down. Looks pretty stochastic: galaxies form stars at a steady average rate that varies up and down on short timescales.

Short-term fluctuations in the SFR explain the data with current SFR higher than the past average. These are the points that stray into the gray region of the plot, which becomes increasingly forbidden towards the top left. This is because galaxies that form stars so fast for too long will build up their entire stellar mass in the blink of a cosmic eye. This is illustrated by the lines marked as 0.1 and 0.01 of a Hubble time. A galaxy above these lines would make all their stars in < 2 Gyr; it would have had to be born yesterday. No galaxies reside in this part of the diagram. Those that approach it are called “starbursts:” they’re forming stars at a high specific rate (relative to their mass) but this is presumably a brief-lived phenomenon.

Note that the most massive of the SINGS galaxies all fall below the extrapolation of the line fit to the LSB galaxies (dotted line). The are forming a lot of stars in an absolute sense, simply because they are giant galaxies. But the current SFR is lower than the past average, as if they were winding down. This “quenching” seems to be a mass-dependent phenomenon: more massive galaxies evolve faster, burning through their gas supply before dwarfs do. Red and dead galaxies have already completed this process; the massive spirals of today are weary giants that may join the red and dead galaxy population in the future.

One consequence of mass-dependent quenching is that it skews attempts to fit relations to the SFMS. There are very many such attempts in the literature; these usually have a slope less than one. The dashed line in the plot above gives one specific example. There are many others.

If one looks only at the most massive SINGS galaxies, the slope is indeed shallower than one. Selection effects bias galaxy catalogs strongly in favor of the biggest and brightest, so most work has been done on massive galaxies with M* > 1010 M. That only covers the top one tenth of the area of this graph. If that’s what you’ve got to work with, you get a shallow slope like the dashed line.

The dashed line does a lousy job of extrapolating to low mass. This is obvious from the dwarf galaxy data. It is also obvious from the simple mathematical considerations outlined above. Low mass galaxies could only fall on the dashed line if they were born yesterday. Otherwise, their high specific star formation rates would over-produce their observed stellar mass.

Despite this simple physical limit, fits to the SFMS that stray into the forbidden zone are ubiquitous in the literature. In addition to selection effects, I suspect the calibrations of both SFR and stellar mass are in part to blame. Galaxies will stray into the forbidden zone if the stellar mass is underestimated or the SFR is overestimated, or some combination of the two. Probably both are going on at some level. I suspect the larger problem is in the SFR. In particular, it appears that many measurements of the SFR have been over-corrected for the effects of dust. Such a correction certainly has to be made, but since extinction corrections are exponential, it is easy to over-do. Indeed, I suspect this is why the dashed line overshoots even the bright galaxies from SINGS.

This brings us back to the terminology of the main sequence. Among stars, the main sequence is defined by low mass stars that evolve slowly. There is a turn-off point, and an associated mass, where stars transition from the main sequence to the sub giant branch. They then ascend the red giant branch as they evolve.

If we project this terminology onto galaxies, the main sequence should be defined by the low mass dwarfs. These are nowhere near to exhausting their gas supplies, so can continue to form stars far into the future. They establish a star forming main sequence of slope unity because that’s what the math says they must do.

Most of the literature on this subject refers to massive star forming galaxies. These are not the main sequence. They are the turn-off population. Massive spirals are near to exhausting their gas supply. Star formation is winding down as the fuel runs out.

Red and dead galaxies are the next stage, once star formation has stopped entirely. I suppose these are the red giants in this strained analogy to individual stars. That is appropriate insofar as most of the light from red and dead galaxies is produced by red giant stars. But is this really they right way to think about it? Or are we letting our terminology get the best of us?