Clusters of galaxies ruin everything

Clusters of galaxies ruin everything

A common refrain I hear is that MOND works well in galaxies, but not in clusters of galaxies. The oft-unspoken but absolutely intended implication is that we can therefore dismiss MOND and never speak of it again. That’s silly.

Even if MOND is wrong, that it works as well as it does is surely telling us something. I would like to know why that is. Perhaps it has something to do with the nature of dark matter, but we need to engage with it to make sense of it. We will never make progress if we ignore it.

Like the seventeenth century cleric Paul Gerhardt, I’m a stickler for intellectual honesty:

“When a man lies, he murders some part of the world.”

Paul Gerhardt

I would extend this to ignoring facts. One should not only be truthful, but also as complete as possible. It does not suffice to be truthful about things that support a particular position while eliding unpleasant or unpopular facts* that point in another direction. By ignoring the successes of MOND, we murder a part of the world.

Clusters of galaxies are problematic in different ways for different paradigms. Here I’ll recap three ways in which they point in different directions.

1. Cluster baryon fractions

An unpleasant fact for MOND is that it does not suffice to explain the mass discrepancy in clusters of galaxies. When we apply Milgrom’s formula to galaxies, it explains the discrepancy that is conventionally attributed to dark matter. When we apply MOND clusters, it comes up short. This has been known for a long time; here is a figure from the review Sanders & McGaugh (2002):
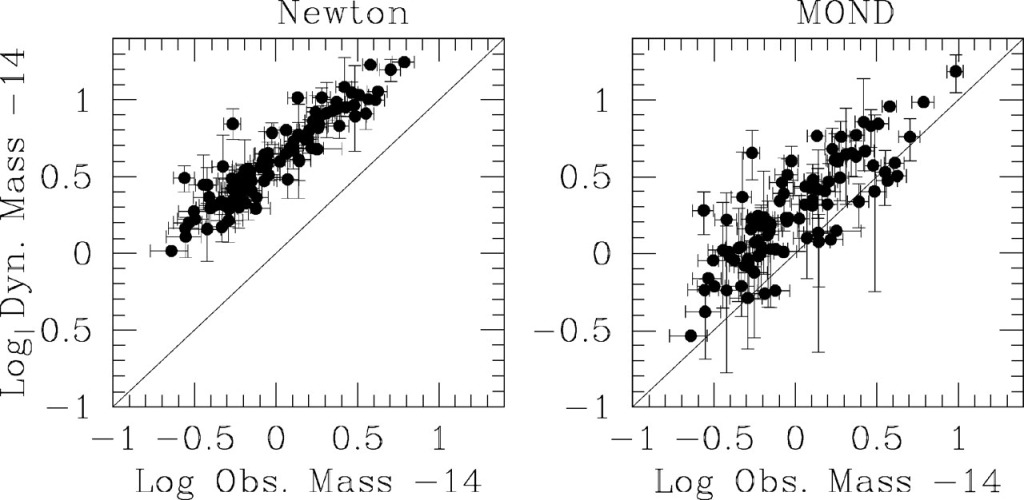
Figure 10 from Sanders & McGaugh (2002): (Left) the Newtonian dynamical mass of clusters of galaxies within an observed cutoff radius (rout) vs. the total observable mass in 93 X-ray-emitting clusters of galaxies (White et al. 1997). The solid line corresponds to Mdyn = Mobs (no discrepancy). (Right) the MOND dynamical mass within rout vs. the total observable mass for the same X-ray-emitting clusters. From Sanders (1999).

The Newtonian dynamical mass exceeds what is seen in baryons (left). There is a missing mass problem in clusters. The inference is that the difference is made up by dark matter – presumably the same non-baryonic cold dark matter that we need in cosmology.

When we apply MOND, the data do not fall on the line of equality as they should (right panel). There is still excess mass. MOND suffers a missing baryon problem in clusters.

The common line of reasoning is that MOND still needs dark matter in clusters, so why consider it further? The whole point of MOND is to do away with the need of dark matter, so it is terrible if we need both! Why not just have dark matter?

This attitude was reinforced by the discovery of the Bullet Cluster. You can “see” the dark matter.
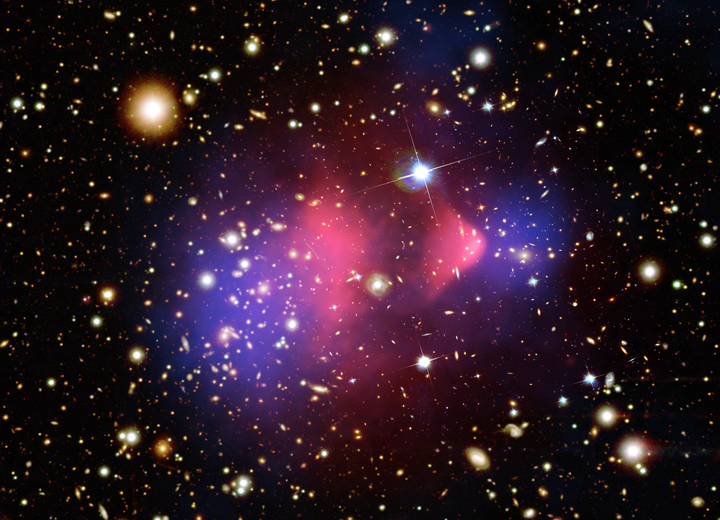
An artistic rendition of data for the Bullet Cluster. Pink represents hot X-ray emitting gas, blue the mass concentration inferred through gravitational lensing, and the optical image shows many galaxies. There are two clumps of galaxies that collided and passed through one another, getting ahead of the gas which shocked on impact and lags behind as a result. The gas of the smaller “bullet” subcluster shows a distinctive shock wave.

Of course, we can’t really see the dark matter. What we see is that the mass required by gravitational lensing observations exceeds what we see in normal matter: this is the same discrepancy that Zwicky first noticed in the 1930s. The important thing about the Bullet Cluster is that the mass is associated with the location of the galaxies, not with the gas.

The baryons that we know about in clusters are mostly in the gas, which outweighs the stars by roughly an order of magnitude. So we might expect, in a modified gravity theory like MOND, that the lensing signal would peak up on the gas, not the stars. That would be true, if the gas we see were indeed the majority of the baryons. We already knew from the first plot above that this is not the case.

I use the term missing baryons above intentionally. If one already believes in dark matter, then it is perfectly reasonable to infer that the unseen mass in clusters is the non-baryonic cold dark matter. But there is nothing about the data for clusters that requires this. There is also no reason to expect every baryon to be detected. So the unseen mass in clusters could just be ordinary matter that does not happen to be in a form we can readily detect.

I do not like the missing baryon hypothesis for clusters in MOND. I struggle to imagine how we could hide the required amount of baryonic mass, which is comparable to or exceeds the gas mass. But we know from the first figure that such a component is indicated. Indeed, the Bullet Cluster falls at the top end of the plots above, being one of the most massive objects known. From that perspective, it is perfectly ordinary: it shows the same discrepancy every other cluster shows. So the discovery of the Bullet was neither here nor there to me; it was just another example of the same problem. Indeed, it would have been weird if it hadn’t shown the same discrepancy that every other cluster showed. That it does so in a nifty visual is, well, nifty, but so what? I’m more concerned that the entire population of clusters shows a discrepancy than that this one nifty case does so.

The one new thing that the Bullet Cluster did teach us is that whatever the missing mass is, it is collisionless. The gas shocked when it collided, and lags behind the galaxies. Whatever the unseen mass is, is passed through unscathed, just like the galaxies. Anything with mass separated by lots of space will do that: stars, galaxies, cold dark matter particles, hard-to-see baryonic objects like brown dwarfs or black holes, or even massive [potentially sterile] neutrinos. All of those are logical possibilities, though none of them make a heck of a lot of sense.

As much as I dislike the possibility of unseen baryons, it is important to keep the history of the subject in mind. When Zwicky discovered the need for dark matter in clusters, the discrepancy was huge: a factor of a thousand. Some of that was due to having the distance scale wrong, but most of it was due to seeing only stars. It wasn’t until 40 some years later that we started to recognize that there was intracluster gas, and that it outweighed the stars. So for a long time, the mass ratio of dark to luminous mass was around 70:1 (using a modern distance scale), and we didn’t worry much about the absurd size of this number; mostly we just cited it as evidence that there had to be something massive and non-baryonic out there.

Really there were two missing mass problems in clusters: a baryonic missing mass problem, and a dynamical missing mass problem. Most of the baryons turned out to be in the form of intracluster gas, not stars. So the 70:1 ratio changed to 7:1. That’s a big change! It brings the ratio down from a silly number to something that is temptingly close to the universal baryon fraction of cosmology. Consequently, it becomes reasonable to believe that clusters are fair samples of the universe. All the baryons have been detected, and the remaining discrepancy is entirely due to non-baryonic cold dark matter.

That’s a relatively recent realization. For decades, we didn’t recognize that most of the normal matter in clusters was in an as-yet unseen form. There had been two distinct missing mass problems. Could it happen again? Have we really detected all the baryons, or are there still more lurking there to be discovered? I think it unlikely, but fifty years ago I would also have thought it unlikely that there would have been more mass in intracluster gas than in stars in galaxies. I was ten years old then, but it is clear from the literature that no one else was seriously worried about this at the time. Heck, when I first read Milgrom’s original paper on clusters, I thought he was engaging in wishful thinking to invoke the X-ray gas as possibly containing a lot of the mass. Turns out he was right; it just isn’t quite enough.

All that said, I nevertheless think the residual missing baryon problem MOND suffers in clusters is a serious one. I do not see a reasonable solution. Unfortunately, as I’ve discussed before, LCDM suffers an analogous missing baryon problem in galaxies, so pick your poison.

It is reasonable to imagine in LCDM that some of the missing baryons on galaxy scales are present in the form of warm/hot circum-galactic gas. We’ve been looking for that for a while, and have had some success – at least for bright galaxies where the discrepancy is modest. But the problem gets progressively worse for lower mass galaxies, so it is a bold presumption that the check-sum will work out. There is no indication (beyond faith) that it will, and the fact that it gets progressively worse for lower masses is a direct consequence of the data for galaxies looking like MOND rather than LCDM.

Consequently, both paradigms suffer a residual missing baryon problem. One is seen as fatal while the other is barely seen.

2. Cluster collision speeds

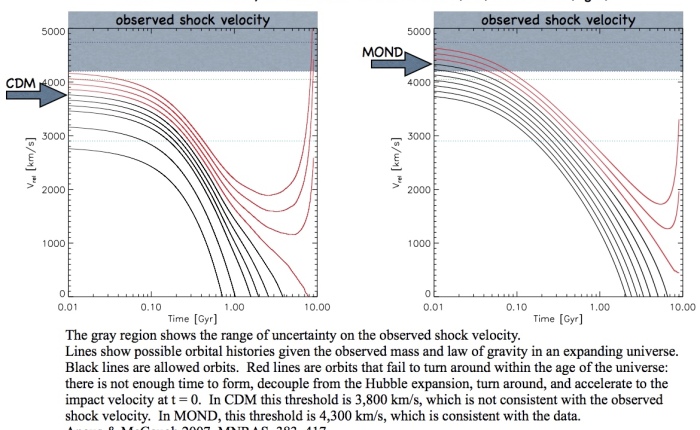
A novel thing the Bullet Cluster provides is a way to estimate the speed at which its subclusters collided. You can see the shock front in the X-ray gas in the picture above. The morphology of this feature is sensitive to the speed and other details of the collision. In order to reproduce it, the two subclusters had to collide head-on, in the plane of the sky (practically all the motion is transverse), and fast. I mean, really fast: nominally 4700 km/s. That is more than the virial speed of either cluster, and more than you would expect from dropping one object onto the other. How likely is this to happen?

There is now an enormous literature on this subject, which I won’t attempt to review. It was recognized early on that the high apparent collision speed was unlikely in LCDM. The chances of observing the bullet cluster even once in an LCDM universe range from merely unlikely (~10%) to completely absurd (< 3 x 10⁻⁹). Answers this varied follow from what aspects of both observation and theory are considered, and the annoying fact that the distribution of collision speed probabilities plummets like a stone so that slightly different estimates of the “true” collision speed make a big difference to the inferred probability. What the “true” gravitationally induced collision speed is is somewhat uncertain because the hydrodynamics of the gas plays a role in shaping the shock morphology. There is a long debate about this which bores me; it boils down to it being easy to explain a few hundred extra km/s but hard to get up to the extra 1000 km/s that is needed.

At its simplest, we can imagine the two subclusters forming in the early universe, initially expanding apart along with the Hubble flow like everything else. At some point, their mutual attraction overcomes the expansion, and the two start to fall together. How fast can they get going in the time allotted?

The Bullet Cluster is one of the most massive systems in the universe, so there is lots of dark mass to accelerate the subclusters towards each other. The object is less massive in MOND, even spotting it some unseen baryons, but the long-range force is stronger. Which effect wins?

Gary Angus wrote a code to address this simple question both conventionally and in MOND. Turns out, the longer range force wins this race. MOND is good at making things go fast. While the collision speed of the Bullet Cluster is problematic for LCDM, it is rather natural in MOND. Here is a comparison:

A reasonable answer falls out of MOND with no fuss and no muss. There is room for some hydrodynamical+ high jinx, but it isn’t needed, and the amount that is reasonable makes an already reasonable result more reasonable, boosting the collision speed from the edge of the observed band to pretty much smack in the middle. This is the sort of thing that keeps me puzzled: much as I’d like to go with the flow and just accept that it has to be dark matter that’s correct, it seems like every time there is a big surprise in LCDM, MOND just does it. Why? This must be telling us something.

3. Cluster formation times

Structure is predicted to form earlier in MOND than in LCDM. This is true for both galaxies and clusters of galaxies. In his thesis, Jay Franck found lots of candidate clusters at redshifts higher than expected. Even groups of clusters:

Figure 7 from Franck & McGaugh (2016). A group of four protocluster candidates at z = 3.5 that are proximate in space. The left panel is the sky association of the candidates, while the right panel shows their galaxy distribution along the LOS. The ellipses/boxes show the search volume boundaries (Rsearch = 20 cMpc, Δz ± 20 cMpc). Three of these (CCPC-z34-005, CCPC-z34-006, CCPC-z35-003) exist in a chain along the LOS stretching ≤120 cMpc. This may become a supercluster-sized structure at z = 0.

The cluster candidates at high redshift that Jay found are more common in the real universe than seen with mock observations made using the same techniques within the Millennium simulation. Their velocity dispersions are also larger than comparable simulated objects. This implies that the amount of mass that has assembled is larger than expected at that time in LCDM, or that speeds are boosted by something like MOND, or nothing has settled into anything like equilibrium yet. The last option seems most likely to me, but that doesn’t reconcile matters with LCDM, as we don’t see the same effect in the simulation.

MOND also predicts the early emergence of the cosmic web, which would explain the early appearance of very extended structures like the “big ring.” While some of these very large scale structures are probably not real, there seem to be a lot of such things being noted for all of them to be an illusion. The knee-jerk denials of all such structures reminds me of the shock cosmologists expressed at seeing quasars at redshifts as high as 4 (even 4.9! how can it be so?) or clusters are redshift 2, or the original CfA stickman, which surprised the bejeepers out of everybody in 1987. So many times I’ve been told that a thing can’t be true because it violates theoretician’s preconceptions, only for them to prove to be true, ultimately to be something the theorists expected all along.

Well, which is it?

So, as the title says, clusters ruin everything. The residual missing baryon problem that MOND suffers in clusters is both pernicious and persistent. It isn’t the outright falsification that many people presume it to be, but is sure don’t sit right. On the other hand, both the collision speeds of clusters (there are more examples now than just the Bullet Cluster) and the early appearance of clusters at high redshift is considerably more natural in MOND than In LCDM. So the data for clusters cuts both ways. Taking the most obvious interpretation of the Bullet Cluster data, this one object falsifies both LCDM and MOND.

As always, the conclusion one draws depends on how one weighs the different lines of evidence. This is always an invitation to the bane of cognitive dissonance, accepting that which supports our pre-existing world view and rejecting the validity of evidence that calls it into question. That’s why we have the scientific method. It was application of the scientific method that caused me to change my mind: maybe I was wrong to be so sure of the existence of cold dark matter? Maybe I’m wrong now to take MOND seriously? That’s why I’ve set criteria by which I would change my mind. What are yours?


*In the discussion associated with a debate held at KITP in 2018, one particle physicist said “We should just stop talking about rotation curves.” Straight-up said it out loud! No notes, no irony, no recognition that the dark matter paradigm faces problems beyond rotation curves.

+There are now multiple examples of colliding cluster systems known. They’re a mess (Abell 520 is also called “the train wreck cluster“), so I won’t attempt to describe them all. In Angus & McGaugh (2008) we did note that MOND predicted that high collision speeds would be more frequent than in LCDM, and I have seen nothing to make me doubt that. Indeed, Xavier Hernandez pointed out to me that supersonic shocks like that of the Bullet Cluster are often observed, but basically never occur in cosmological simulations.
Discussion of Dark Matter and Modified Gravity

To start the new year, I provide a link to a discussion I had with Simon White on Phil Halper’s YouTube channel:

In this post I’ll say little that we don’t talk about, but will add some background and mildly amusing anecdotes. I’ll also try addressing the one point of factual disagreement. For the most part, Simon & I entirely agree about the relevant facts; what we’re discussing is the interpretation of those facts. It was a perfectly civil conversation, and I hope it can provide an example for how it is possible to have a positive discussion about a controversial topic+ without personal animus.

First, I’ll comment on the title, in particular the “vs.” This is not really Simon vs. me. This is a discussion between two scientists who are trying to understand how the universe works (no small ask!). We’ve been asked to advocate for different viewpoints, so one might call it “Dark Matter vs. MOND.” I expect Simon and I could swap sides and have an equally interesting discussion. One needs to be able to do that in order to not simply be a partisan hack. It’s not like MOND is my theory – I falsified my own hypothesis long ago, and got dragged reluctantly into this business for honestly reporting that Milgrom got right what I got wrong.

For those who don’t know, Simon White is one of the preeminent scholars working on cosmological computer simulations, having done important work on galaxy formation and structure formation, the baryon fraction in clusters, and the structure of dark matter halos (Simon is the W in NFW halos). He was a Reader at the Institute of Astronomy at the University of Cambridge where we overlapped (it was my first postdoc) before he moved on to become the director of the Max Planck Institute for Astrophysics where he was mentor to many people now working in the field.

That’s a very short summary of a long and distinguished career; Simon has done lots of other things. I highlight these works because they came up at some point in our discussion. Davis, Efstathiou, Frenk, & White are the “gang of four” that was mentioned; around Cambridge I also occasionally heard them referred to as the Cold Dark Mafia. The baryon fraction of clusters was one of the key observations that led from SCDM to LCDM.

The subject of galaxy formation runs throughout our discussion. It is always a fraught issue how things form in astronomy. It is one thing to understand how stars evolve, once made; making them in the first place is another matter. Hard as that is to do in simulations, galaxy formation involves the extra element of dark matter in an expanding universe. Understanding how galaxies come to be is essential to predicting anything about what they are now, at least in the context of LCDM*. Both Simon and I have worked on this subject our entire careers, in very much the same framework if from different perspectives – by which I mean he is a theorist who does some observational work while I’m an observer who does some theory, not LCDM vs. MOND.

When Simon moved to Max Planck, the center of galaxy formation work moved as well – it seemed like he took half of Cambridge astronomy with him. This included my then-office mate, Houjun Mo. At one point I refer to the paper Mo & I wrote on the clustering of low surface brightness galaxies and how I expected them to reside in late-forming dark matter halos**. I often cite Mo, Mao, & White as a touchstone of galaxy formation theory in LCDM; they subsequently wrote an entire textbook about it. (I was already warning them then that I didn’t think their explanations of the Tully-Fisher relation were viable, at least not when combined with the effect we have subsequently named the diversity of rotation curve shapes.)

When I first began to worry that we were barking up the wrong tree with dark matter, I asked myself what could falsify it. It was hard to come up with good answers, and I worried it wasn’t falsifiable. So I started asking other people what would falsify cold dark matter. Most did not answer. They often had a shocked look like they’d never thought about it, and would rather not***. It’s a bind: no one wants it to be false, but most everyone accepts that for it to qualify as physical science it should be falsifiable. So it was a question that always provoked a record-scratch moment in which most scientists simply freeze up.

Simon was one of the first to give a straight answer to this question without hesitation, circa 1999. At that point it was clear that dark matter halos formed central density cusps in simulations; so those “cusps had to exist” in the centers of galaxies. At that point, we believed that to mean all galaxies. The question was complicated by the large dynamical contribution of stars in high surface brightness galaxies, but low surface brightness galaxies were dark matter dominated down to small radii. So we thought these were the ideal place to test the cusp hypothesis.

We no longer believe that. After many attempts at evasion, cold dark matter failed this test; feedback was invoked, and the goalposts started to move. There is now a consensus among simulators that feedback in intermediate mass galaxies can alter the inner mass distribution of dark matter halos. Exactly how this happens depends on who you ask, but it is at least possible to explain the absence of the predicted cusps. This goes in the right direction to explain some data, but by itself does not suffice to address the thornier question of why the distribution of baryons is predictive of the kinematics even when the mass is dominated by dark matter. This is why the discussion focused on the lowest mass galaxies where there hasn’t been enough star formation to drive the feedback necessary to alter cusps. Some of these galaxies can be described as having cusps, but probably not all. Thinking only in those terms elides the fact that MOND has a better record of predictive success. I want to know why this happens; it must surely be telling us something important about how the universe works.

The one point of factual disagreement we encountered had to do with the mass profile of galaxies at large radii as traced by gravitational lensing. It is always necessary to agree on the facts before debating their interpretation, so we didn’t press this far. Afterwards, Simon sent a citation to what he was talking about: this paper by Wang et al. (2016). In particular, look at their Fig. 4:

Fig. 4 of Wang et al. (2016). The excess surface density inferred from gravitational lensing for galaxies in different mass bins (data points) compared to mock observations of the same quantity made from within a simulation (lines). Looks like excellent agreement.

This plot quantifies the mass distribution around isolated galaxies to very large scales. There is good agreement between the lensing observations and the mock observations made within a simulation. Indeed, one can see an initial downward bend corresponding to the outer part of an NFW halo (the “one-halo term”), then an inflection to different behavior due to the presence of surrounding dark matter halos (the “two-halo term”). This is what Simon was talking about when he said gravitational lensing was in good agreement with LCDM.

I was thinking of a different, closely related result. I had in mind the work of Brouwer et al. (2021), which I discussed previously. Very recently, Dr. Tobias Mistele has made a revised analysis of these data. That’s worthy its own post, so I’ll leave out the details, which can be found in this preprint. The bottom line is in Fig. 2, which shows the radial acceleration relation derived from gravitational lensing around isolated galaxies:

The radial acceleration relation from weak gravitational lensing (colored points) extending existing kinematic data (grey points) to lower acceleration corresponding to very large radii (~ 1 Mpc). The dashed line is the prediction of MOND. Looks like excellent agreement.

This plot quantifies the radial acceleration due to the gravitational potential of isolated galaxies to very low accelerations. There is good agreement between the lensing observations and the extrapolation of the radial acceleration relation predicted by MOND. There are no features until extremely low acceleration where there may be a hint of the external field effect. This is what I was talking about when I said gravitational lensing was in good agreement with MOND, and that the data indicated a single halo with an r-2 density profile that extends far out where we ought to see the r-3 behavior of NFW.

The two plots above use the same method applied to the same kind of data. They should be consistent, yet they seem to tell a different story. This is the point of factual disagreement Simon and I had, so we let it be. No point in arguing about the interpretation when you can’t agree on the facts.

I do not know why these results differ, and I’m not going to attempt to solve it here. I suspect it has something to do with sample selection. Both studies rely on isolated galaxies, but how do we define that? How well do we achieve the goal of identifying isolated galaxies? No galaxy is an island; at some level, there is always a neighbor. But is it massive enough to perturb the lensing signal, or can we successfully define samples of galaxies that are effectively isolated, so that we’re only looking at the gravitational potential of that galaxy and not that of it plus some neighbors? Looks like there is some work left to do to sort this out.

Stepping back from that, we agreed on pretty much everything else. MOND as a fundamental theory remains incomplete. LCDM requires us to believe that 95% of the mass-energy content of the universe is something unknown and perhaps unknowable. Dark matter has become familiar as a term but remains a mystery so long as it goes undetected in the laboratory. Perhaps it exists and cannot be detected – this is a logical possibility – but that would be the least satisfactory result possible: we might as well resume counting angels on the head of a pin.

The community has been working on these issues for a long time. I have been working on this for a long time. It is a big problem. There is lots left to do.


+I get a lot of kill the messenger from people who are not capable of discussing controversial topics without personal animus. A lotinevitably from people who know assume they know more about the subject than I do but actually know much less. It is really amazing how many scientists equate me as a person with MOND as a theory without bothering to do any fact-checking. This is logical fallacy 101.

*The predictions of MOND are insensitive to the details of galaxy formation. Though of course an interesting question, we don’t need that in order to make predictions. All we need is the mass distribution that the kinematics respond to – we don’t need to know how it got that way. This is like the solar system, where it suffices to know Newton’s laws to compute orbits; we don’t need to know how the sun and planets formed. In contrast, one needs to know how a galaxy was assembled in LCDM to have any hope of predicting what its distribution of dark matter is and then using that to predict kinematics.

**The ideas Mo & I discussed thirty years ago have reappeared in the literature under the designation “assembly bias.”

***It was often accompanied by “why would you even ask that?” followed by a pained, constipated expression when they realized that every physical theory has to answer that question.

Wide binary debate heats up again

Wide binary debate heats up again

One of the most interesting and contentious results concerning MOND this year has been the dynamics of wide binaries. When last I wrote on this topic, way back at the end of August, Chae (2023) and Hernandez (2023) both had new papers finding evidence for MONDian behavior in wide binaries. Since that time, they each have written additional papers on the subject. These independent efforts both report strong evidence for MONDian behavior in wide binaries, so for all of October it seemed like Game Over for conventional* dark matter.

I refrained from writing a post then because I was still waiting to see if there would be a contradictory paper. Now there is. And boy, is it contradictory! Where Hernandez et al. find 2.6σ evidence for non-Newtonian behavior and Chae finds ~5σ evidence for non-Newtonian behavior, both consistent with MOND, Banik et al. find purely Newtonian behavior and claim to exclude MOND at 19σ. That’s pretty high confidence!

Well, which is it, young feller? You got proof of non-Newtonian dynamics, or you want to insist that’s impossible?

After the latest results appeared, a red-hot debate [re]ignited on e-mail, largely along the lines of what was discussed at the conference in St. Andrews. Banik et al say that they can reproduce the MOND-like signal of Chae, but that it goes away when the data quality restriction is applied to physical velocity uncertainties (arguing that this is what you want to know) rather than to raw observational uncertainties. Chae and Hernandez counter that the method Banik et al. apply is not grounded in the Newtonian regime where everyone agrees on what should happen, so they could be calibrating the signal away. This is one thing that I had the impression that everyone had agreed to work on in St. Andrews, but it doesn’t appear that we’re there yet.

Banik et al. do a carefully planned Bayesian analysis. This approach in principle allows one to separate many effects simultaneously, one of which is close binaries (CB**). I look at the impact that close binaries have on the analysis, and it gives me the heebie-jeebies:

One panel from Fig. 10 of Banik et al.

This figure illustrates the probability of measuring a characteristic velocity in MOND for the noted range of projected sky separation. If it is just wide binaries (WB), you get the blue line. If there are some close binaries, the expected distribution changes dramatically. This change is rather larger than the signal expected from the nominal difference in gravity. You can in principle fit for everything simultaneously, but extracting the right small signal when there is a big competing signal can be tricky. Bayesian analyses can help, but they are also a double-sided sledge-hammer: a powerful tool with which to pound the data, but also a tool that can bounce back and smack you in the face. Having done such analyses, and been smacked around a few times (and having seen others get smacked around), looking at this plot really does give me the heebie-jeebies. There are lots of ways in which this can go wrong – or even just overstate the confidence of a correct result.

Everyone uses Bayesian methods these days.***

I expect people are expecting me to comment on this hot mess. Some have already asked me to do so. I really don’t want to. I’ve already said more than I should.

There are very earnest, respectable people doing this work; I don’t think anyone is being intentionally misleading. Somebody must be wrong, but it isn’t my job to sort out who. Moreover, these are long and involved analyses; it will take me time to read all the papers and make sense of them. Maybe once I do, I’ll have something more cogent to say.

I make no promises.


*By conventional dark matter, I mean new particles that only communicate with baryons via gravity.

**CB: In principle, some of the wide binaries detected by Gaia will also be close binaries, in the sense that one of the two widely separated stars is itself not a single star but an unrecognized close binary. We know this happen in nature: the nearest star system, αCentauri, is an example. The main A&B components compose a close binary with Proxima Centauri being widely separated. Modeling how often this happens in the Gaia data gives me the willies.

***To paraphrase Churchill: Many forms of statistics have been tried, and will be tried in this science of sin and woe. No one pretends+ that Bayes is perfect or all-wise. Indeed it has been said that Bayes is the worst form of statistics except for all those other forms that have been tried from time to time.

+Lots of people pretend that Bayes is perfect and all-wise.

Recent Developments Concerning the Gravitational Potential of the Milky Way. III. A Closer Look at the RAR Model

Recent Developments Concerning the Gravitational Potential of the Milky Way. III. A Closer Look at the RAR Model

I am primarily an extragalactic astronomer – someone who studies galaxies outside our own. Our home Galaxy is a subject in its own right. Naturally, I became curious how the Milky Way appeared in the light of the systematic behaviors we have learned from external galaxies. I first wrote a paper about it in 2008; in the process I realized that I could use the RAR to infer the distribution of stellar mass from the terminal velocities observed in interstellar gas. That’s not necessary in external galaxies, where we can measure the light distribution, but we don’t get a view of the whole Galaxy from our location within it. Still, it wasn’t my field, so it wasn’t until 2015/16 that I did the exercise in detail. Shortly after that, the folks who study the supermassive black hole at the center of the Galaxy provided a very precise constraint on the distance there. That was the one big systematic uncertainty in my own work up to that point, but I had guessed well enough, so it didn’t make a big change. Still, I updated the model to the new distance in 2018, and provided its details on my model page so anyone could use it. Then Gaia data started to pour in, which was overwhelming, but I found I really didn’t need to do any updating: the second data release indicated a declining rotation curve at exactly the rate the model predicted: -1.7 km/s/kpc. So far so good.

I call it the RAR model because it only involves the radial force. All I did was assume that the Milky Way was a typical spiral galaxy that followed the RAR, and ask what the mass distribution of the stars needed to be to match the observed terminal velocities. This is a purely empirical exercise that should work regardless of the underlying cause of the RAR, be it MOND or something else. Of course, MOND is the only theory that explicitly predicted the RAR ahead of time, but we’ve gone to great lengths to establish that the RAR is present empirically whether we know about MOND or not. If we accept that the cause of the RAR is MOND, which is the natural interpretation, then MOND over-predicts the vertical motions by a bit. That may be an important clue, either into how MOND works (it doesn’t necessarily follow the most naive assumption) or how something else might cause the observed MONDian phenomenology, or it could just be another systematic uncertainty of the sort that always plagues astronomy. Here I will focus on the RAR model, highlighting specific radial ranges where the details of the RAR model provide insight that can’t be obtained in other ways.

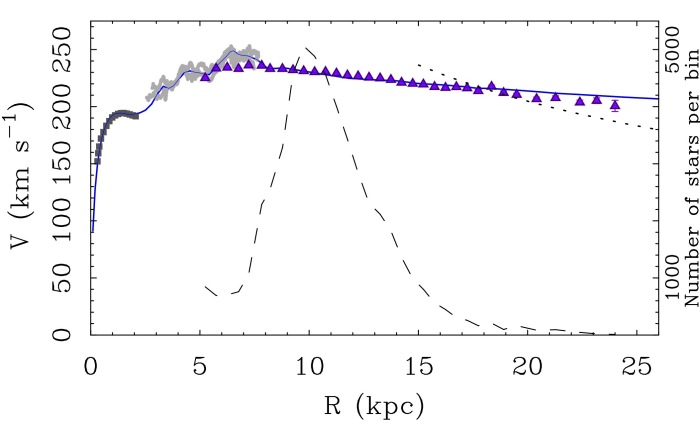
The RAR Milky Way model was fit to the terminal velocity data (in grey) over the radial range 3 < R < 8 kpc. Everything outside of that range is a prediction. It is not a prediction limited to that skinny blue line, as I have to extrapolate the mass distribution of the Milky Way to arbitrarily large radii. If there is a gradient in the mass-to-light ratio, or even if I guess a little wrong in the extrapolation, it’ll go off at some point. It shouldn’t be far off, as V(R) is mostly fixed by the enclosed mass. Mostly. If there is something else out there, it’ll be higher (like the cyan line including an estimate of the coronal gas in the plot that goes out to 130 kpc). If there is a bit less than the extrapolation, it’ll be lower.

The RAR model Milky Way (blue line) together with the terminal velocities to which it was fit (light grey points), VVV data in the inner 2.2 kpc (dark grey squares), and the Zhou et al. (2023) realization of the Gaia DR3 data. Also shown are the number of stars per bin from Gaia (right axis).

From 8 to 19 kpc, the Gaia data as realized by Zhao et al. fall bang on the model. They evince exactly the slowly declining rotation curve that was predicted. That’s pretty good for an extrapolation from R < 8 kpc. I’m not aware of any other model that did this well in advance of the observation. Indeed, I can’t think of a way to even make a prediction with a dark matter model. I’ve tried this – a lot – and it is as easy to come up with a model whose rotation curve is rising as one that is falling. There’s nothing in the dark matter paradigm that is predictive at this level of detail.

Beyond R > 19 kpc, the match of the model and Zhou et al. realization of the data is not perfect. It is still pretty damn good by astronomical standards, and better than the Keplerian dotted line. Cosmologists would be wetting themselves with excitement if they could come this close to predicting anything. Heck, they’re known to do that even when they’re obviously wrong*.

If the difference between the outermost data and the blue line is correct, then all it means is that we have to tweak the model to have a bit less mass than assumed in the extrapolation. I call it a tweak because it would be exactly that: a small change to an assumption I was obliged to make in order to do the calculation. I could have assumed something else, and almost did: there is discussion in the literature that the disk of the Milky Way is truncated at 20 kpc. I considered using a mass model with such a feature, but one can’t make it a sharp edge as that introduces numerical artifacts when solving the Poisson equation numerically, as this procedure depends on derivatives that blow up when they encounter sharp features. Presumably the physical truncation isn’t unphysically sharp anyway, rather being a transition to a steeper exponential decline as we sometimes see in other galaxies. However, despite indications of such an effect, there wasn’t enough data to constrain it in a way useful for my model. So rather than introduce a bunch of extra, unconstrained freedom into the model, I made a straight extrapolation from what I had all the way to infinity in the full knowledge that this had to be wrong at some level. Perhaps we’ve found that level.

That said, I’m happy with the agreement of the data with the model as is. The data become very sparse where there is even a hint of disagreement. Where there are thousands of stars per bin in the well-fit portion of the rotation curve, there are only tens per bin outside 20 kpc. When the numbers get that small, one has to start to worry that there are not enough independent samples of phase space. A sizeable fraction of those tens of stars could be part of the same stellar stream, which would bias the results to that particular unrepresentative orbit. I don’t know if that’s the case, which is the point: it is just one of the many potential systematic uncertainties that are not represented in the formal error bars. Missing those last five points by two sigma is as likely to be an indication that the error bars have been underestimated as it is to be an indication that the model is inadequate. Trying to account for this sort of thing is why the error bars of Jiao et al. are so much bigger than the formal uncertainties in the three realization papers.

That’s the outer regions. The place where the RAR model disagrees the most with the Gaia data is from 5 < R < 8 kpc, which is in the range where it was fit! So what’s going on there?

Again, the data disagree with the data. The stellar data from Gaia disagree with the terminal velocity data from interstellar gas at high significance. The RAR model was fit to the latter, so it must per force disagree with the former. It is tempting to dismiss one or the other as wrong, but do they really disagree?

Adapted from Fig. 4 of McGaugh (2019). Grey points are the first and fourth quadrant terminal velocity data to which the model (blue line) was matched. The red squares are the stellar rotation curve estimated with Gaia DR2 (DR3 is indistinguishable). The black squares are the stellar rotation curve after adjustment to be consistent with a mass profile that includes spiral arms. This adjustment for self-consistency remedies the apparent discrepancy between gas and stellar data.

In order to build the model depicted above, I chose to split the difference between the first and fourth quadrant terminal velocity data. I fit them separately in McGaugh (2016) where I made the additional point that the apparent difference between the two quadrants is what we expect from an m=2 mode – i.e., a galaxy with spiral arms. That means these velocities are not exactly circular as commonly assumed, and as I must per force assume to build the model. So I split the difference above in the full knowledge that this is not the exact circular velocity curve of the Galaxy, it’s just the best I can do at present. This is another example of the systematic uncertainties we encounter: the difference between the first and fourth quadrant is real and is telling us that the galaxy is not azimuthally symmetric – as anyone can tell by looking at any spiral galaxy, but is a detail we’d like to ignore so we can talk about disk+dark matter halo models in the convenient limit of axisymmetry.

Though not perfect – no model is – the RAR model Milky Way is a lot better than models that ignore spiral structure entirely, which is basically all of them. The standard procedure assumes an exponential disk and some form of dark matter halo. Allowance is usually made for a central bulge component, but it is relatively rare to bother to include the interstellar gas, much less consider deviations from a pure exponential disk. Having adopted the approximation of an exponential disk, one inevitably get a smooth rotation curve like the dashed line below:

Fig. 1 from McGaugh (2019). Red points are the binned fourth quadrant molecular hydrogen terminal velocities to which the model (blue line) has been fit. The dotted lines shows the corresponding Newtonian rotation curve of the baryons. The dashed line is the model of Bovy & Rix (2013) built assuming an exponential disk. The inset shows residuals of the models from the data. The exponential model does not and cannot fit these data.

The common assumption of exponential disk precludes the possibility of fitting the bumps and wiggles observed in the terminal velocities. These occur because of deviations from a pure exponential profile caused by features like spiral arms. By making this assumption, the variations in mass due to spiral arms is artificially smoothed over. They are not there by assumption, and there is no way to recover them in a dark matter fit that doesn’t know about the RAR.

Depending on what one is trying to accomplish, an exponential model may suffice. The Bovy & Rix model shown above is perfectly reasonable for what they were trying to do, which involved the vertical motions of stars, not the bumps and wiggles in the rotation curve. I would say that the result they obtain is in reasonable agreement with the rotation curve, given what they were doing and in full knowledge that we can’t expect to hit every error bar of every datum of every sort. But for the benefit of the chi-square enthusiasts who are concerned about missing a few data points at large radii, the reduced chi-squared of the Bovy & Rix model is 14.35 while that of the RAR model is 0.6. A good fit is around 1, so the RAR model is a good fit while the smooth exponential is terrible – as one can see by eye in the residual inset: the smooth exponential model gets the overall amplitude about right, but hits none of the data. That’s the starting point for every dark matter model that assumes an exponential disk; even if they do a marginally better job of fitting the alleged Keplerian downturn, they’re still a lot worse if we consider the terminal velocity data, the details of which are usually ignored.

If instead we pay attention the details of the terminal velocity data, we discover that the broad features seen there in are pretty much what we expect for the kinematic signatures of photometrically known spiral arms. That is, the mass density variations inferred by fitting the RAR correspond to spiral arms that are independently known from star counts. We’ve discussed this before.

Spiral structure in the Milky Way (left) as traced by HII regions and Giant Molecular Clouds (GMCs). These correspond to bumps in the surface density profile inferred from kinematics with the RAR (right).

If we accept that the bumps and wiggles in the terminal velocities are tracers of bumps and wiggles in the stellar mass profiles, as seen in external galaxies, then we can return to examining the apparent discrepancy between them and the stellar rotation curve from Gaia. The latter follow from an application of the Jeans equation, which helps us sort out the circular motion from the mildly eccentric orbits of many stars. It includes a term that depends on the gradient of the density profile of the stars that trace the gravitational potential. If we assume an exponential disk, then that term is easily calculated. It is slowly and smoothly varying, and has little impact on the outcome. One can explore variations of the assumed scale length of the disk, and these likewise have little impact, leading us to infer that we don’t need to worry about it. The trouble with this inference is that it is predicated on the assumption of a smooth exponential disk. We are implicitly assuming that there are no bumps and wiggles.

The bumps and wiggles are explicitly part of the RAR model. Consequently, the gradient term in the Jeans equation has a modest but important impact on the result. Applying it to the Gaia data, I get the black points:

The red squares are the Gaia DR2 data. The black squares are the same data after including in the Jeans equation the effect of variations in the tracer gradient. This term dominates the uncertainties.

The velocities of the Gaia data in the range illustrated all go up. This systematic effect reconciles the apparent discrepancy between the stellar and gas rotation curves. The red points are highly discrepant from the gray points, but the black points are not. All it took was to drop the assumption of a smooth exponential profile and calculate the density gradient numerically from the data. This difference has a more pronounced impact on rotation curve fits than any of the differences between the various realizations of the Gaia DR3 data – hence my cavalier attitude towards their error bars. Those are not the important uncertainties.

Indeed, I caution that we still don’t know what the effective circular velocity of the potential is. I’ve made my best guess by splitting the difference between the first and fourth quadrant terminal velocity data, but I’ve surely not got it perfectly right. One might view the difference between the quadrants as the level at which the perfect quantity is practically unknowable. I don’t think it is quite that bad, but I hope I have at least given the reader some flavor for some of the hidden systematic uncertainties that we struggle with in astronomy.

It gets worse! At small radii, there is good reason to be wary of the extent to which terminal velocities represent circular motion. Our Galaxy hosts a strong bar, as artistically depicted here:

Artist’s rendition of the Milky Way. Image credit: NASA/JPL-Caltech.

Bars are a rich topic in their own right. They are supported by non-circular orbits that maintain their pattern. Consequently, one does not expect gas in the region where the bar is to be on circular orbits. It is not entirely clear how long the bar in our Galaxy is, but it is at least 3 kpc – which is why I have not attempted to fit data interior to that. I do, however, have to account for the mass in that region. So I built a model based on the observed light distribution. It’s a nifty bit of math to work out the equivalent circular velocity corresponding to a triaxial bar structure, so having done it once I’ve not been keen to do it again. This fixes the shape of the rotation curve in the inner region, though the amplitude may shift up and down with the mass-to-light ratio of the stars, which dominate the gravitational potential at small radii. This deserves its own close up:

Colored points are terminal velocities from Marasco et al. (2017), from both molecular (red) and atomic (green) gas. Light gray circles are from Sofue (2020). These are plotted assuming they represent circular motions, which they do not. Dark grey squares are the equivalent circular velocity inferred from stars in the VVV survey. The black line is the Newtonian mass model for the central bar and disk, and the blue line is the corresponding RAR model as seen above.

Here is another place where the terminal velocities disagree with the stellar data. This time, it is because the terminal velocities do not trace circular motion. If we assume they do, then we get what is depicted above, and for many years, that was thought to be the Galactic rotation curve, complete with a pronounced classical bulge. Many decades later, we know the center of the Galaxy is not dominated by a bulge but rather a bar, with concominant non-circular motions – motions that have been observed in the stars and carefully used to reconstruct the equivalent circular velocity curve by Portail et al. (2017). This is exactly what we need to compare to the RAR model.

Note that 2008, when the bar model was constructed, predates 2017 (or the 2016 appearance of the preprint). While it would have been fair to tweak the model as the data improved, this did not prove necessary. The RAR model effectively predicted the inner rotation curve a priori. That’s a considerably more impressive feat than getting the outer slope right, but the model manages both sans effort.

No dark matter model can make an equivalent boast. Indeed, it is not obvious how to do this at all; usually people just make a crude assumption with some convenient approximation like the Hernquist potential and call it a day without bothering to fit the inner data. The obvious prediction for a dark matter model overshoots the inner rotation curve, as there is no room for the cusp predicted in cold dark matter halos – stars dominate the central potential. One can of course invoke feedback to fix this, but it is a post hoc kludge rather than a prediction, and one that isn’t supposed to apply in galaxies as massive as the Milky Way. Unless it needs to, of course.

So, lets’s see – the RAR model Milky Way reconciles the tension between stellar and interstellar velocity data, indicates density bumps that are in the right location to correspond to actual spiral arms, matches the effective circular velocity curve determined for stars in the Galactic bar, correctly predicted the slope of the rotation curve outside the solar circle out to at least 19 kpc, and is consistent with the bulk of the data at much larger radii. That’s a pretty successful model. Some realizations of the Gaia DR3 data are a bit lower than predicted, but others are not. Hopefully our knowledge of the outer rotation curve will continue to improve. Maybe the day will come when the data have improved to the point where the model needs to be tweaked a little bit, but it is not this day.


*To give one example, the BICEP II experiment infamously claimed in March of 2014 to have detected the Inflationary signal of primordial gravitational waves in their polarization data. They held a huge press conference to announce the result in clear anticipation of earning a Nobel prize. They did this before releasing the science paper, much less hearing back from a referee. When they did release the science paper, it was immediately obvious on inspection that they had incorrectly estimated the dust foreground. Their signal was just that – excess foreground emission. I could see that in a quick glance at the relevant figure as soon as the paper was made available. Literally – I picked it up, scanned through it, saw the relevant figure, and could immediately spot where they had gone wrong. And yet this huge group of scientists all signed their name to the submitted paper and hyped it as the cosmic “discovery of the century”. Pfft.

Recent Developments Concerning the Gravitational Potential of the Milky Way. II. A Closer Look at the Data

Recent Developments Concerning the Gravitational Potential of the Milky Way. II. A Closer Look at the Data

Continuing from last time, let’s compare recent rotation curve determinations from Gaia DR3:

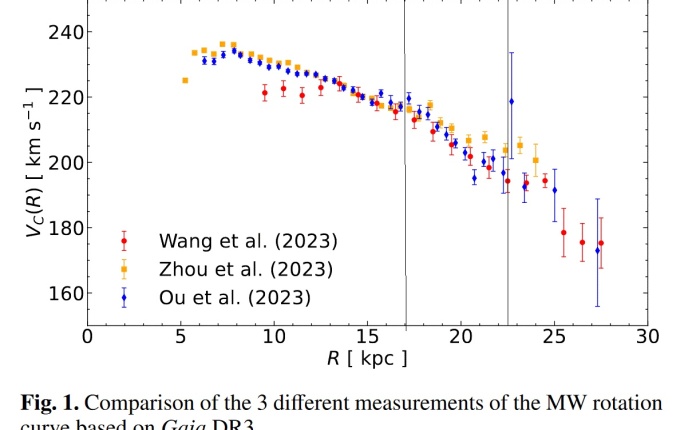
Fig. 1 from Jiao et al. comparing three different realizations of the Galactic rotation curve from Gaia DR3. The vertical lines* mark the range of the Ou et al. data considered by Chan & Chung Law (2023).

These are different analyses of the same dataset. The Gaia data release is immense, with billions of stars. There are gazillions of ways to parse these data. So it is reasonable to have multiple realizations, and we shouldn’t expect them to necessarily agree perfectly: do we look exclusively at K giants? A stars? Only stars with proper motion and/or parallax data more accurate than some limit? etc. Of course we want to understand any differences, but that’s not going to happen here.

My first observation is that the various analyses are broadly consistent. They all show a steady decline over a large range of radii. Nothing shocking there; it is fairly typical for bright, compact galaxies like the Milky Way to have somewhat declining rotation curves. The issue here, of course, is how much, and what does it mean?

Looking more closely, not all of the data agree with each other, or even with themselves. There are offsets between the three at radii around the sun (we live just outside R = 8 kpc) where you’d naively think they would agree the best. They’re very consistent from 13 < R < 17 kpc, then they start to diverge a little. The Ou data have a curious uptick right around R = 17 kpc, which I wouldn’t put much stock in; weird kinks like that sometimes happen in astronomical data. But it can’t be consistent with a continuous mass distribution, and will come up again for other reasons.

As an astronomer, I’m happy with the level of agreement I see here. It is not perfect, in the sense that there are some points from one data set whose error bars do not overlap with those of other data sets in places. That’s normal in astronomy, and one of the reasons that we can never entirely trust the stated uncertainties. Jiao et al. make a thorough and yet still incomplete assessment of the systematic uncertainties, winding up with larger error bars on the Wang et al. realization of the data.

For example, one – just one of the issues we have to contend with – is the distance to each star in the sample. Distances to individual objects are hard, and subject to systematic uncertainties. The reason to choose A stars or K giants is because you think you know their luminosity, so can estimate their distance. That works, but aren’t necessarily consistent (let alone correct) among the different groups. That by itself could be the source of the modest difference we see between data sets.

Chan & Chung Law use the Ou et al. realization of the data to make some strong claims. One is that the gradient of the rotation curve is -5 km/s/kpc, and this excludes MOND at high confidence. Here is their plot.

You will notice that, as they say, these are the data of Ou et al, being identical to the same points in the plot from Jiao et al. above – provided you only look in the range between the lines, 17 < R < 23 kpc. This is where the kink at R = 17 kpc comes in. They appear to have truncated the data right where it needs to be truncated to ignore the point with a noticeably lower velocity, which would surely affect the determination of the slope and reduce its confidence level. They also exclude the point with a really big error bar that nominally is within their radial range. That’s OK, as it has little significance: it’s large error bar means it contributes little to the constraint. That is not the case for the datum just inside of R = 17 kpc, or the rest of the data at smaller radii for that matter. These have a manifestly shallower slope. Looking at the line boundaries added to Jiao’s plot, it appears that they selected the range of the data with the steepest gradient. This is called cherry-picking.

It is a strange form of cherry-picking, as there is no physical reason to expect a linear fit to be appropriate. A Keplerian downturn has velocity decline as the inverse square root of radius (see the dotted line above.) These data, over this limited range, may be consistent with a Keplerian downturn, but certainly do not establish that it is required.

Contrast the statements of Chan & Chung Law with the more measured statement from the paper where the data analysis is actually performed:

… a low mass for the Galaxy is driven by the functional forms tested, given that it probes beyond our measurements. It is found to be in tension with mass measurements from globular clusters, dwarf satellites, and streams.

Ou et al. (2023)

What this means is that the data do not go far enough out to measure the total mass. The low mass that is inferred from the data is a result of fitting some specific choice of halo form to it. They note that the result disagrees with other data, as I discussed last time.

Rather than cherry pick the data, we should look at all of it. Let’s see, I’ve done that before. We looked at the Wang et al. (2023) data via Jiao et al. previously, and just discussed the Ou et al. data. That leaves the new Zhao et al. data, so let’s look at those:

Milky Way rotation curve with RAR model (blue line from 2018) and the Gaia DR3 data as realized by Zhou et al. (2023: purple triangles). The dashed line shows the number of stars (right axis) informing each datum.

These data were the last of the current crop that I looked at. They look… pretty good in comparison with the pre-existing RAR model. Not exactly the falsification I had been led to expect.

So – the three different realizations of the Gaia DR3 data are largely consistent, yet one is being portrayed as a falsification of MOND while another is in good agreement with its prediction.

This is why you have to take astronomical error bars with a grain of salt. Three different groups are using data from the same source to obtain very nearly the same result. It isn’t quite the same result, as some of the data disagree at the formal limits of their uncertainty. No big deal – that’s what happens in astronomy. The number of stars per bin helps illustrate one reason why: we go from thousands of stars per bin near the sun to tens of stars in wider bins at R > 20 kpc. That’s not necessarily problematic, but it is emblematic of what we’re dealing with: great gobs of data up close, but only scarce scratches of it far away where systematic effects are more pernicious.

In the meantime, one realization of these data are being portrayed as a death knell for a theory that successfully predicts another realization of the same data. Well, which is it?


*Thanks to Moti Milgrom for pointing out the restricted range of radii considered by Chan & Chung Law and adding the vertical lines to this figure.

Recent Developments Concerning the Gravitational Potential of the Milky Way. I.

Recent Developments Concerning the Gravitational Potential of the Milky Way. I.

Recent results from the third data release (DR3) from Gaia has led to a flurry of papers. Some are good, some are great, some are neither of those. It is apparent from the comments last time that while I’ve kept my pledge to never dumb it down, I have perhaps been assuming more background knowledge on the part of readers than is adequate. I can’t cram a graduate education in astronomy into one web page, but will try to provide a little relevant context.

Galactic Astronomy is an ancient field, dating back at least to the Herschels. There is a lot that is known in the field. There have also been a lot of misleading observations, going back just as far to the Herschel’s map of the Milky Way, which was severely limited by extinction from interstellar dust. That’s easy to say now, but Herschel’s map was the standard for over a century – longer than our modern map has persisted.

So a lot has changed, including a lot that seemed certain, so I try to keep an open mind. The astronomers working with the Gaia data – the ones deriving the rotation curve – are simply following where those data take them, as they should. There are others using their analyses to less credible ends. A lot of context is required to distinguish the two.

The total mass of the Milky Way

There are a lot of constraints on the mass of the Milky Way that predate Gaia; it’s not like these are the first data that address the issue. Indeed, there are lots and lots and lots of other applicable data acquired using different methods over the course of many decades. Here is a summary plot of determinations of the mass of the Milky Way compiled by Wang et al. (2019).

This is an admirable compilation, and yet no such compilation can be complete. There are just so many determinations by lots of independent authors. Still, this is nice for listing multiple results from many distinct methodologies. They all consistently give numbers around 1012 solar masses. (Cast in these terms, my own estimate is 1.4 x 10¹² albeit with a substantial systematic uncertainty.) I’ve added a point for the total mass according to the alleged Keplerian downturn seen in the Gaia data, 2 x 10¹¹ solar masses. One of these things is not like the others.

The difference from the bulk of the data has nearly every astronomer rolling our collective eyes. Most of us straight up don’t believe it. That’s not to say the Gaia data are wrong, but the interpretation of those data as indicative of such a small, finite total mass seems unlikely in the light of all other results.

As I discussed briefly last time, it is conceivable that previous results are wrong or misleading due to some systematic effect or bad assumption. For example, mass estimates based on “satellite phenomenon” require the assumption that the satellite galaxies are indeed satellites of the Milky Way on bound orbits. That seems like a really good assumption, as without it, their presence is an instantaneous coincidence particular to the most recent few percent of a Hubble time: they wouldn’t have been nearby more than a billion years ago, and won’t be around another for even a few hundred million more. That sounds like a long time to you and me, but it is not that long on a cosmic scale. Maybe they’re raining down all the time to give the appearance of a steady state? Where have I heard that before?

Even if we’re willing to dismiss satellite constraints, that doesn’t suffice. It isn’t good enough to find flaw with one set of determinations; one must question all distinct methods. I could probably do that; there’s always a systematic uncertainty that might be bigger than expected or an assumption that could go badly wrong. But it is asking a lot for all of them to conspire to be wrong at the same time by the same amount. (The assumption of Newtonian gravity is a catch-all.)

Some constraints are more difficult to dodge than others. For example, the escape velocity method merely notes that there are fast moving stars in the solar neighborhood. Those stars are many billions of years old, and wouldn’t be here if the gravitational potential couldn’t contain them. The mass implied by the Gaia quasi-Keplerian downturn doesn’t suffice.

That said, the total mass of the Milky Way as expressed above is a rather notional quantity. M200 occurs roughly 200 kpc out for the Milky Way, give or take a lot. And the “200” in the subscript has nothing to do with that radius being 200 kpc for reasons too technical and silly to delve into. So my biggest concern about the compilation above is not that the data are wrong so much as they are being extrapolated to an idealized radius that we don’t directly observe. This extrapolation is usually done by assuming the potential of an NFW halo, which makes perfect sense in terms of LCDM but none whatsoever empirically, since NFW predicts the wrong density profile at small, intermediate, and large radii: where the density profile ρ ∝ r is predicted to have α = (1,2,3), it is persistently observed to be more like (0,1,2). While the latter profile is empirically more realistic, it also fails to converge to a finite total mass, rendering the concept meaningless.

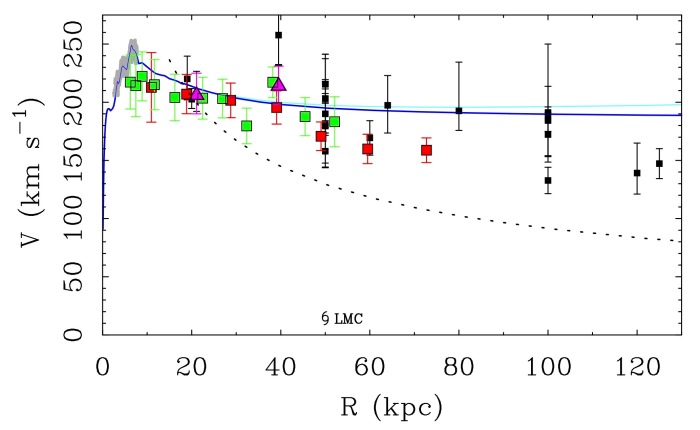
Rather than indulge yet again in a discussion of the virtues and vices of different dark matter halo profiles, let’s look at an observationally more robust quantity: the enclosed mass. Wang et al. also provide a tabulation of this quantity from many sources, as depicted here:

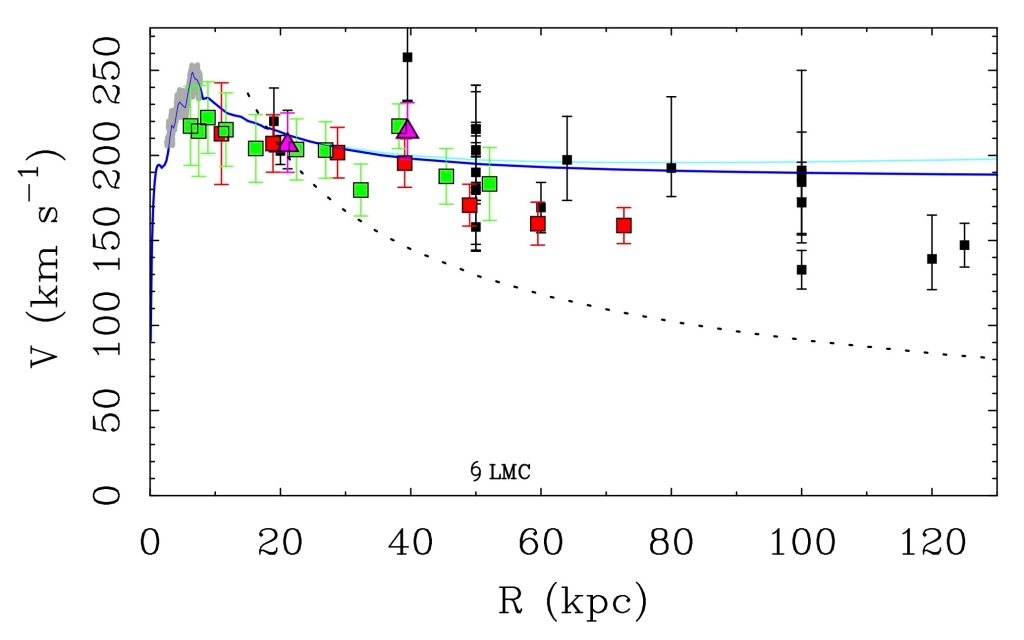
Rotation curve constraints implied by the enclosed mass measurements tabulated by Wang et al. (2019) combined with the halo stars and globular clusters previously discussed. The location of the Large Magellanic Cloud is also indicated; data beyond this radius (and perhaps even within it) are subject to perturbation by the passage of the LMC. The RAR-based model is shown as the blue line; the light blue line includes a very uncertain estimate of the effect of the coronal gas. This is very diffuse and extended, and only becomes significant at very large radii. The dotted line is the Keplerian curve for a mass of 2 x 10¹¹ M.

Not all of the enclosed mass data are consistent with one another. The bulk of them are consistent with the RAR model Milky Way (blue line). None of them are consistent with the small mass indicated by recent Gaia analyses (dotted line). Hence the collective unwillingness of most astronomers to accept the low-mass interpretation.

An important thing to note when considering data at large radii, especially those beyond 50 kpc, is that 50 kpc is the current Galactocentric radius of the Large Magellanic Cloud. The LMC brings with it its own dark matter halo, which perturbs the outer regions of the Milky Way. This effect is surprisingly strong*, and leads to the inference that the mass ratio of the two is only 4 or 5:1 even though the luminosity ratio is more like 20:1. This makes the interpretation of the data beyond 50 kpc problematic. If we use that as a pretext to ignore it, then we infer that our low mass Milky Way is no more massive then the LMC – an apparently absurd situation.

There are many rabbit holes we could dig down here, but the basic message is that a small Milky Way mass violates a gazillion well-established constraints. That doesn’t mean the Gaia data are wrong, but it does call into question their interpretation. So next time we’ll look more closely at the data.


*This is not surprising in MOND. The LMC is in the right place at the right time to cause the Galactic warp. The LMC as a candidate perturber to excite the Galactic warp was recognized early, but the conventional mass was thought to be much too small to do the job. The small baryonic mass of the LMC in MOND is not a problem as the long range nature of the force law makes tidal effects more pronounced: it works out about right.

Is the Milky Way’s rotation curve declining?

Is the Milky Way’s rotation curve declining?

Yes, some. That much is a step forward from a decade ago, when a common assumption was that the Milky Way’s rotation curve remained flat at the speed at which the sun orbited. This was a good guess based on empirical experience with other galaxies, but not all galaxies have rotation curves that are completely flat, nor can we be sure the sun is located where that is the case.

A bigger question whether the Milky Way’s rotation curve is declining in a Keplerian fashion. This would indicate that the total mass has been enclosed. That would be a remarkable result. If true, it would be the first time that the total mass of an individual galaxy has been measured. There have been claims to this effect before that have not panned out when the data have been extended to larger radii, so one might be inclined to be skeptical.

There are several claims now to see a distinctly declining rotation curve based on the third data release (DR3) from Gaia. The most recent, Jiao et al., has gained some note by virtue of putting “Keplerian decline” in the title, but very similar results have also been reported by Ou et al., Wang et al. and Sylos Labini et al. They all obtain basically the same answer using the same data, with minor differences in the error assessment and other details. There are also differences in interpretation*, which is always possible even when everyone agrees about what the data say.

Jiao et al. measure a total mass for the Milky Way of about 2 x 10¹¹ M. Before looking at the data, let’s take a moment to think about that number. Most mass determinations – and there are lots, see Fig. 2 of Wang et al. – for the Milky Way have been in the neighborhood of 1012 M. Indeed, for most of my career, it was traditionally Known to be 2 x 10¹² M. The new measurement is an order of magnitude smaller. That’s a lot to be off by, even in extragalactic astronomy. The difference, as we’ll see, has to do with what data we use.

The mass of stars and gas in the Milky Way is about 6 x 10¹⁰ M, give or take ten billion. That means that nearly a third of the total mass is normal baryonic matter that we can readily see. So the ratio of dark-to-baryonic mass is only 2.3:1, well short of the cosmic ratio of about 6:1. That’s embarrassing – especially since much of the effort in galaxy formation theory has been to explain why the baryon fraction is much less than the cosmic fraction, not much more. And here our Galaxy is an outlier, having much less dark matter for its stellar mass than everything else. It is always a bad sign when the Galaxy appears to violate the Copernican Principle.

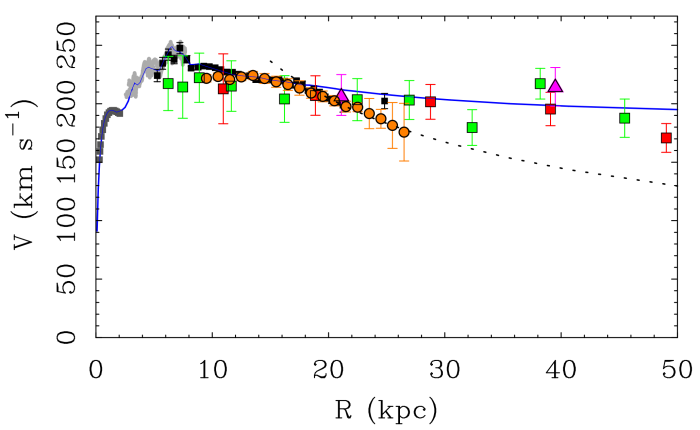
Nonetheless, this is what we find if we look at the Gaia DR3 data. Here is a model I’ve shown before, extrapolated to larger radii with some new data added. The orange circles are the Gaia DR3 rotation curve as given by Jiao et al. For radii greater than 18 kpc, they show a clear decline consistent with a Keplerian curve for a 1.95 x 10¹¹ M point mass (dotted line), as per Fig. 9 of Jiao et al.

Milky Way model (blue line) compared with various data.

This is the first time we’ve been able to trace the rotation curve so far out with stars in the disk of the Milky Way, and the Keplerian line is a good match. If that’s all we know, then a total mass of only 2 x 10¹¹ M is a reasonable inference. That’s not all we know.

As I alluded above, a halo mass this small makes no sense in the context of cosmology. Not only is 2 x 10¹¹ M too small, the more commonly inferred dynamical mass of 1012 M is also too small. According to abundance matching, which has become an important aspect of LCDM, the Milky Way should reside in a 3 or 4 x 10¹² M halo. So the new mass makes a factor of 2 or 3 problem into a factor a ten problem. That is too large to attribute to scatter in the stellar mass-halo mass relation. Worse, there is no evidence that the Milky Way is an outlier from scaling relations like Tully-Fisher. We can’t have it one way and not the other.

The traditional mass estimates that obtain ~1012 M rely on dwarf satellite galaxies as tracers of the gravitational potential of the Milky Way. Maybe they’re not fair tracers? We have to make assumptions about their orbits to use them to infer a mass; perhaps these assumptions are wrong? It is conceivable that many of our satellites are on first infall rather than in well-established orbits. Indeed, the consensus is that our largest satellites, the Magellanic Clouds, are on first infall, and that they cause a substantial perturbation to the halo of the Milky Way. This was an absurd thought 15 years ago – the Magellanic clouds must have been here forever, and were far too small to do damage – but now this is standard lore.

There are tracers at large radii besides dwarf satellite galaxies. The figure above shows three: globular clusters (pink triangles) and two types of stars in the halo: blue horizontal branch stars (green squares) and K giants (red squares). These are well-known parts of the Milky Way that have been with us for many billions of years, so they’ve had plenty of time to become equilibrium tracers of the gravitational potential. They clearly indicate a larger enclosed mass than predicted by the Keplerian decline traced by the Gaia rotation curve, and are consistent with traditional satellite analyses. Perhaps these data are somehow misleading, but it is hard to see how.

Gaia is great, but has its limits. It is really optimized for nearby stars (within a few kpc). Outside of that, the statistics… leave something to be desired. Is it safe to push out beyond 20 kpc? I don’t know, but I did notice this panel from Fig. 8 of Wang et al.:

Radial velocities of stars at different heights above the Galactic plane.

The radial velocity is a minor component of disk motion, where azimuthal motion dominates. However, one does need to know it to solve the Jeans equation. Having it wrong will cause a perceptible systematic error. You notice the bifurcation in the data for R > 22 kpc? That, in technical terms, is Messed Up. I don’t know what goes awry there, but I’ve done this exercise enough times for the sight of this to scare the bejeepers out of me. No way I trust any of these data at R > 22 kpc, and I hope having seen this doesn’t give me nightmares tonight.

Perhaps the uncertainty caused by this is adequately reflected in the large error bars on the orange points above. Those with R > 22 kpc are nicely Keplerian, but also consistent with a lot of things, including the blue line that successfully predicts the halo stars and globular clusters. That’s not true for the data around R = 20 kpc where the error bars are much smaller: there the discrepancy with the blue line I take seriously. But that is a much more limited affair that might indicate the presence of a ring of mass – that’s what gives the bumps and wiggles at smaller radii – and certainly isn’t enough to imply the entire mass of the Milky Way has been enclosed.

But who knows? Perhaps fifteen years hence it will be the standard lore that all galaxies reside in dark matter halos that are only twice the mass of their luminous disks. At that mass ratio, all the galactic dark matter could be baryonic. I wouldn’t bet on it, but stranger things have happened before, and will happen again.


*A difference in interpretation is largely what the debate about dark matter and MOND boils down to. There is no doubt that there are acceleration discrepancies in extragalactic objects that require something beyond what you see is what you get with normal gravity. Whether we should blame what we can’t see or the assumption of normal gravity is open to interpretation. I would hope this is obvious, but this elementary point seems to be lost on many.

Wide Binary Results Favoring MOND

I think the time has come for another update on wide binaries. These were intensely debated at the conference in St. Andrews, with opposing camps saying they did or did not show MONDian behavior. Two papers by independent authors have recently been refereed and published: Chae (2023) in the Astrophysical Journal and Hernandez (2023) in Monthly Notices. These papers both find evidence for MONDian behavior in wide binaries.

If these new results are correct, they are the smoking gun for MOND. I’ve been trying to avoid that phrase, and think of how we would explain this with dark matter. I haven’t come up with any good ideas. This doesn’t preclude others from coming up with bad ideas, but the problem this result poses is profound.

The basic idea is that galaxies reside in dark matter halos. These are diffuse entities with a particular mass distribution that must contribute the right gravitational force to explain observations on galactic scales. On local scales, like the solar neighborhood, this leads to a very low space density of about 0.007 solar masses per cubic parsec, or 0.26 GeV/cm3. For comparison, the local density of stars and gas is about 0.11 solar masses per cubic parsec. Adding up all the dark matter in the solar system within the orbit of Pluto amounts to the equivalent mass of a one km-size asteroid. That doesn’t do anything noticeable to solar system dynamics, especially when it is spread out as expected rather than concentrated in an asteroid.

Wide binaries should encompass more dark matter than the solar system by virtue of their greater size, but the enclosed mass remains too tiny to affect the orbits of the stars. There could be the occasional lump of dark matter, but those should be few and far between: the conventional expectation for binary stars is purely Newtonian, with no hint of a mass discrepancy. In contrast, the expectation in MOND is that every system that experiences the low acceleration regime should show a discrepancy of predictable amplitude. I simply don’t see how to imitate that with any of the usual dark matter suspects.

Here is the results from Chae’s paper. There are many figures like this that explore all sorts of permutations on sample selection and other effects. The answer persistently comes up the same. There is a systematic deviation from Newtonian behavior that is consistent with MOND, and in particular with the nonlinear theory AQUAL proposed early on by Bekenstein & Milgrom.

Part of Fig. 19 from Chae (2023). As one goes to lower acceleration, the data for wide binaries agrees well with the prediction of the Aquadratic Lagrangian theory of MOND (purple line in lower panel).

This figure subsumes many astronomical details, like the distribution of orbital eccentricities and the frequency of triple systems. Chae has simulated what to expect as a result of all these effects, with the results in the top panel distinguishing between the Newtonian expectation in blue and the data in red. At high accelerations, the red histogram is right on top of the blue histogram. These distributions are indistinguishable, as they should be in both theories. As one looks to lower accelerations, the red and blue histograms begin to part. They stand clearly apart in the lowest acceleration bin. This is as expected in MOND. In contrast, the histograms should never diverge in the Newtonian case, with or without dark matter.

A similar result has been obtained by Hernandez (2023), who emphasizes the importance of obtaining a clean sample for which one is sure that the binaries are genuinely bound and have radial velocities as well as proper motions. The data follow the Newtonian line until they don’t. The deviation is consistent with MOND.

Part of Fig. A1 from Hernandez (2023). The MOND effect is apparent as the break of the red points from the purely Newtonian blue line.

Again, there are many figures like this in the paper to explore all the possible permutations. These all paint the same picture: MOND. The published result Hernandez obtains is consistent with the result obtained by Chae, relieving a small tension that was present in the preprint stage.

Still outstanding is why Chae and Hernandez get a different answer from Pittordis & Sutherland (2023), who utilize many more binaries. This is a tradeoff that frequently arises in astronomical data analysis: numbers vs. quality. The risk with numbers is that the signal you’re searching for gets drowned out in a sea of noise. The risk in defining a high quality sample is that you unintentionally introduce a selection effect that causes a signal to appear where there isn’t one. It seems unlikely that this would result in MOND-like behavior – it could do any number of crazy things – but I don’t know enough about this specific subject to judge. Note that I’m willing to say when I’m out of my expertise; I expect it won’t be hard to find faux experts who don’t acknowledge the limitations of their qualifications and are perfectly happy to find flaws with studies they dislike but don’t understand.

What I hope to see in future is some convergence between the different groups, or at least for some understanding to emerge as to why their results differ. In the meantime, I expect most of the community will duck and cover.

Checking in on Troubles with Dark Matter

Checking in on Troubles with Dark Matter

It is common to come across statements like “There is overwhelming astrophysical and cosmological evidence that most of the matter in our Universe is dark matter.” This is a gross oversimplification. The astronomical data that indicates the existence of acceleration discrepancies also test the ideas we come up with to explain them. I never considered MOND until I was persuaded by the data that there were serious problems with its interpretation in terms of dark matter.

The community seems to react to problems with the dark matter interpretation in one of several ways. Physicists often seem to simply ignore them, presuming that any problems are mere astronomical details that aren’t relevant to fundamental physics. Among more serious scientists, there is a tendency to bicker over solutions, settle on something (satisfactory or not), then forget that there was ever a problem.

Benoit Famaey and I wrote a long review for Living Reviews in Relativity about a decade ago. In it, we listed some of the problems that afflicted LCDM. It is instructive to review what those were, and examine what progress has been made. The following is based on section 4 of the review. I will skip over the discussion of coincidences, which remain an issue, to focus on specific astronomical problems.

Unobserved predictions

A problem for LCDM, and indeed, any theory, is when it makes predictions that are not confirmed. Here are a list of challenges stemming from observational reality deviating from the expectations or LCDM that we identified in our review, together with an assessment of whether they remain a concern.
The bulk flow challenge
Peculiar velocities of galaxy clusters are predicted to be on the order of 200 km/s in the ΛCDM model: as massive, recently formed objects, they should be nearly at rest with respect to the frame of the cosmic microwave background. Instead, they are observed to have bulk flows of order 1000 km/s.

This appears to remain a problem, and is related to the high collision speeds of objects like the bullet cluster, which basically shouldn’t exist.

The high-z clusters challenge
Structure formation is reputed to be one of the greatest strengths of LCDM, but the observers’ experience has consistently been to find more structure in place earlier than expected. This goes back at least to the 1987 CfA redshift survey stick man figure, which may seem normal now but surprised the bejeepers out of us at the time. It also includes clusters of galaxies, which appear at higher redshift than they should. At the time, we pointed out XMMU J2235.3-2557 with a mass of of ∼ 4 × 10¹⁴ M at z = 1.4 as being very surprising.

More recently we have El Gordo, so this remains a problem.

The Local Void challenge
Peebles has been pointing out for a long time that voids are more empty than they should be, and do not contain the population of galaxies expected in LCDM. They’re too normal, too big, and gee it would help if structure formed faster. In our review, we pointed out that the “Local Void” hosts only 3 galaxies, which is much less than the expected ∼ 20 for a typical similar void in ΛCDM.

I am not seeing much in the literature in the way of updates, so I guess this one has been forgotten and remains a problem.

The missing satellites challenge
LCDM predicts that there are many subhalos in every galactic halo, and one would naturally expect each of these to host a dwarf satellite galaxy. While galaxies like the Milky Way do have dwarf satellites, they number in the dozens when there should be thousands of subhalos. This is manifestly not the case.

The trick with this test is mapping the predicted number of halos to the corresponding galaxies that inhabit them. If there is a nonlinear relation between mass and light, then there can be fewer (or more) dwarf galaxies than halos. People seem to have decided that this problem has been solved.

It is not clear to me how the solutions map to the (contemporaneous with our review) Too Big To Fail problem in which the most massive predicted subhaloes are incompatible with hosting any of the known Milky Way satellites. It isn’t a simple nonlinearity in mass-to-light; some biggish subhalos simply don’t host galaxies, apparently, while many smaller ones do. That doesn’t make sense in terms of the many mass-dependent mechanisms that are invoked to suppress dwarf galaxy formation. Nevertheless, we are assured that it all works out.

The satellites phase-space correlation challenge
This is also known as the planes of satellites problem. At the time of our review, it had recently been recognized that the satellite galaxies of the Milky Way are observed to correlate in phase-space, lying in a seemingly rotation-supported disk. This is pretty much the opposite of what one expects in LCDM, in which subhalos are on randomly oriented, radial orbits.

The problem has gotten worse with more planes now being known around Andromeda and Centaurus A and other galaxies. There have been a steady stream of papers asserting that this is not a problem, but the “solution” seems to be to declare planes to be “common” if their incidence in simulations is a few percent. That is, they seem to agree with the observers who point out that this is a problem, and simply declare it not to be a problem.

The cusp-core challenge
The cusp-core problem is that cold dark matter halos are predicted to have cuspy central regions in which the density of dark matter rises continuously towards their centers, while fitting a dark matter mass distribution to observed galaxies prefers cored halos with a rougly constant density within some finite radius. This has a long history. Observers traditionally used the pseudoisothermal halo profile (with a constant density core) to fit rotation curve data. This was the standard model for a decade before CDM simulations predicted the presence of a central cusp. The pseudoisothermal halo continues to provide a better description of the data. The initial reaction of the theoretical community was to blame the data for not conforming to their predictions: they came up with a series of lame excuses (beam smearing, slit misplacement) for why the data were wrong. Serial improvements in the quality of data showed that these ideas were wrong, and effort switched from reality denial to model modification.

People generally seem to think this problem is solved through the use of baryon feedback to erase the cusps from galaxy halos. I do not find these explanations satisfactory, as they require a just-so fine-tuning to get things right. More generally, this is just one aspect of the challenge presented by galaxy kinematic data. This is what happens if you insist on fitting dark matter halos to data the looks like what MOND predicts. Lots of people seem to think that explaining the cusp-cpore problem solves everything, but this is just one piece of a more general problem, which is not restricted to the central regions. Ultimately, the question remains why MOND works at all in a universe run by dark matter.

I mention all this because it is the prototypical example of why one should take the claims of theorists to have solved a problem with a huge grain of salt. Here, the problem has been redefined into something more limited, then the limited problem has been solved in a seemingly-plausible yet unconvincing way, victory is declared, and the original, more difficult problem (MOND works when it should not) is forgotten or considered to be solved by extension.

The angular momentum challenge
During galaxy formation, the baryons sink to the centers of their dark matter halos. A persistent idea is that they spin up as they do so (like a figure skater pulling her arms in), ultimately establishing a rotationally supported equilibrium in which the galaxy disk is around ten or twenty times smaller than the dark matter halo that birthed it, depending on the initial spin of the halo. This is a seductively simple picture that still has many adherents despite never having really worked. In live simulations, in which baryonic and dark matter particles interact, there is a net transfer of angular momentum from the baryonic disk to the dark halo. This results in simulated disks being much too small.

This problem is solved by invoking just-so feedback again. Whether the feedback one needs to solve this problem is consistent with the feedback one needs to solve the cusp-core problem is unclear, in large part because different groups have different implementations of feedback that all do different things. At most one of them can be right. Given familiarity with the approximations involved, a more likely number is Zero.

The pure disk challenge
Structure forms hierarchically in CDM: small galaxies merge into larger ones. This process is hostile to the existence of dynamically cold, rotating disks, preferring instead to construct dynamically hot, spheroidal galaxies. All the merging destroys disks. Yet spiral galaxies are ubiquitous, and many late type galaxies have no central bulge component at all. At some point it was recognized that the existence of quiescent disks didn’t make a whole lot of sense in LCDM. To form such things, one needs to let gas dissipate and settle into a plane without getting torqued and bombarded by lots of lumps falling onto it from random directions. Indeed, it proved difficult to form large, bulgeless, thin disk galaxies in simulations.
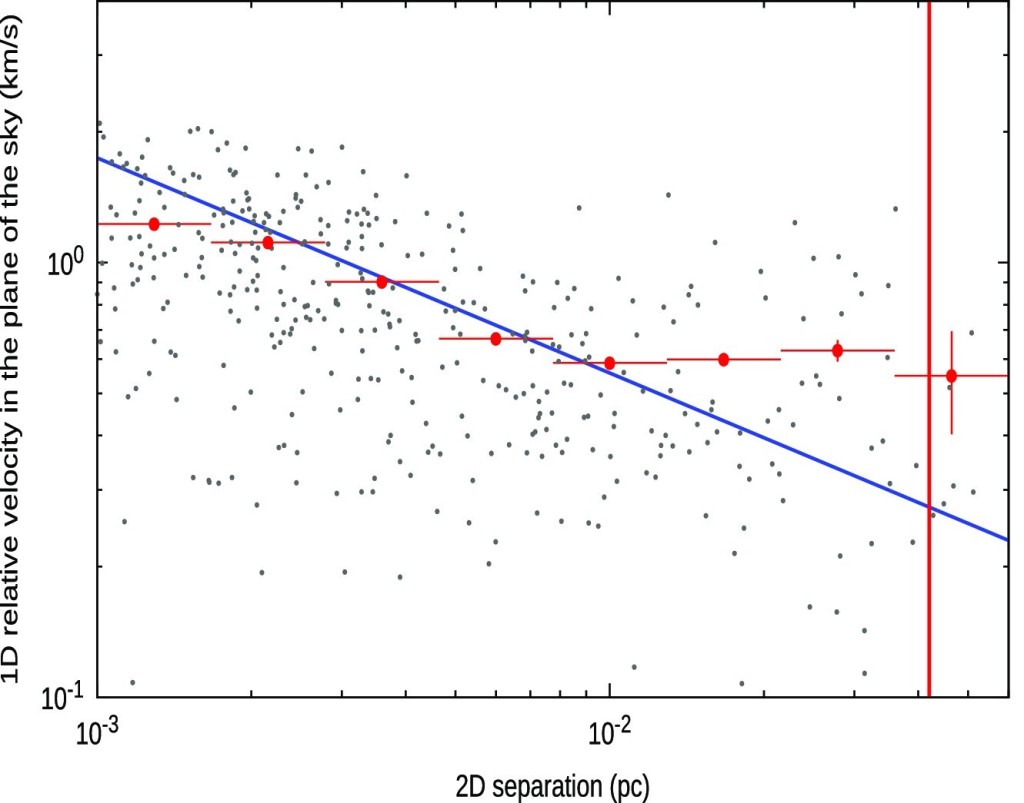
The solution seems to be just-so feedback again, though I don’t see how that can preclude the dynamical chaos caused by merging dark matter halos regardless of what the baryons do.

The stability challenge
One of the early indications of the need for spiral galaxies to be embedded in dark matter halos was the stability of disks. Thin, dynamically cold spiral disks are everywhere around us, yet Newton can’t hold them together by himself: simulated spirals self destruct on a short timescale (a few orbits). A dark matter halo precludes this from happening by counterbalancing the self-gravity of the disk. This is a somewhat fine-tuned situation: too little halo, and a disk goes unstable; too much and disk self-gravity is suppressed – and spiral arms and bars along with it.

I recognized this as a potential test early on. Dark matter halos tend to over-stabilize low surface density disks against the formation of bars and spirals. You need a lot of dark matter to explain the rotation curve, but not too much so as to allow for spiral structure. These tensions can be contradictory, and the tension I anticipated long ago has been realized in subsequent analyses.

The low surface brightness spiral F568-1 (left) and its rotation curve (right). The heavy line indicates the stellar disk mass required to sustain the observed spiral arms; the light line shows what is reasonable for a normal stellar population for which the galaxy consistent with the BTFR and RAR. We can’t have it both ways; this is the predicted contradiction to invoking dark matter to explain both disk stability and kinematics.

I’m not aware of this problem being addressed in the context of cold dark matter models, much less solved. The problem is very much present in modern hydrodynamical simulations, as illustrated by this figure from the enormous review by Banik & Zhao:

The pattern speeds of bars as observed and simulated. Real bars are fast (R = 1) while simulated bars are slow (R > 2) due to the excessive dynamical friction from cuspy dark matter halos. (Fig. 21 from Banik & Zhao 2022).

The missing baryons challenge
The cosmic fraction of baryons – the ratio of normal matter to dark matter – is well known (16 ± 1%). One might reasonably expect individual CDM halos to be in in possession of this universal baryon fraction: the sum of the stars and gas in a galaxy should be 16% of the total, mostly dark mass. However, most objects fall well short of this mark, with the only exception being the most massive clusters of galaxies. So where are all the baryons?

The answer seems to be that we don’t have to answer that. Initially, the poroblem was overcooling: low mass galaxies should turn more of their baryons into stars than is observed. Feedback was invoked to prevent that, and it seems to be widely accepted that feedback from those stars that do form heat much of the surrounding gas so it remains mixed in with the halo in some conveniently unobservable form, or that the feedback is so vigorous that it expells the excess baryons entirely. That the observed baryon fraction declines with declining mass is attributed to the lesser potential wells of smaller galaxies not being able to hang on to their baryons as well – they are more readily expelled. That sounds reasonable at a hand-waving level, but getting it right quantitatively presents a fine-tuning problem: the observed baryon fraction correlates strongly with mass with practically no scatter. One would expect feedback to be rather stochastic and result in a lot of scatter, but if it did it would propagate straight into the Tully-Fisher relation, which has practically no scatter. This fine-tuning problem is addressed by ignoring it.

The more things change

So those are the things that concerned us a decade ago. Looking back on them, there has been some progress on some items and less on others. Being generous, I would say there has at least been progress on the missing satellite problem, cusp-core, angular momentum, and pure disks. There has been no perceptible progress on the other problems, some of which (high-z clusters, disk stability) have gotten worse.

This is all written in the context of dark matter, with only passing reference to MOND. How does MOND fare for these same issues? MOND is good at making things move fast; it naturally predicts the scale of the bulk flows. It also predicted early structure formation, and is good at sweeping the voids clean. It has nothing to say about missing satellites. There are no subhalos that might be populated with dwarfs in MOND, so the question doesn’t arise. It might provide an explanation for the planes of satellites, but I am underwhelmed by this idea (or any others that I’ve heard for this particular problem). MOND is the underlying cause of the cusp-core problem, which arises entirely from trying to fit dark matter halos to galaxies that obey MOND. MOND suffers no angular momentum problem; what you see is what you get. It is noteworthy that angular momentum is not an additonal free parameter as there is no dark component with an unspecified quantity of it; it is specified entirely by the observed distribution of baryons and their motions. Similarly, making pure disks is not a problem for MOND. One can have hierarchical structure formation, but it is not required to the degree that it wipes out nascent disks in the way it did in LCDM simulations before steps were taken to make them stop doing that. Disk stability in MOND stems from the longer range of the force law rather than piling on dark matter; it is comparable for high surface brightness galaxies in both theories, but readily distinguishable for low surface brightness galaxies. This test clearly prefers MOND. Finally, the missing baryon problem doesn’t really pertain in MOND. Objects just have the baryons they have; only in rich clusters of galaxies is there a residual missing baryon problem (albeit a serious one!)

At a conservative count, that is four distinct items that have nothing to do with rotation curves where MOND performs better than LCDM. But go ahead, tell me again how MOND only explains rotation curves and nothing else.


This was basically just section 4.2 of the review. Section 4.3 was about unexpected observations – observations that were surprising in the context of LCDM. I think this post is been long enough, so I won’t go there except to say that these unexpected things were either predicted a priori by MOND, or follow so naturally from it that they could have been if the question had been posed. So it’s not just that MOND explains some things better than dark matter, it’s that it correctly predicted in advance things that were not predicted by dark matter, and that are often not well-explained by it.

The situation remains incommensurate.

The MOND at 40 conference

I’m back from the meeting in St. Andrews, and am mostly recovered from the jet lag and the hiking (it was hot and sunny, we did not pack for that!) and the driving on single-track roads like Mr. Toad. The A835 north from Ullapool provides some spectacular mountain views, but the A837 through Rosehall is more perilous carnival attraction than well-planned means of conveyance.

As expected, the most contentious issue was that of wide binaries. The divide was stark: there were two talks finding nary a hint of MONDian signal, just old Newton, and two talks claiming a clear MONDian signal. Nothing was resolved in the sense of one side convincing the other it was right, but there was progress in terms of [mostly] amicable discussion, with some sensible suggestions for how to proceed. One suggestion was that a neutral party should provide all the groups with several sets of mock data, one Newtonian, one MONDian, and one something else, to see if they all recovered the right answers. That’s a good test in principle, but it is a hassle to do in practice, as it is highly nontrivial to produce realistic mock Gaia data, so no one was leaping at the opportunity to stick their hand in this particular bear trap.

Xavier Hernandez made the excellent point that one should check that one’s method recovers Newtonian behavior for close binaries before making any claims to require/exclude such behavior for wide binaries. Neither MOND nor dark matter predicts any deviation from Newtonian behavior where stars are orbiting each other well in excess of a0, of which there are copious examples, so they provide a touchstone on which all should agree. He also convinced me that it was a Good Idea to have radial velocities as well as proper motions. This limits the sample size, but it helps immensely to insure that sample binaries are indeed bound pairs of binary stars. Doing this, he finds MOND-like behavior.

Previously, I linked to a talk by Indranil Banik, who found Newtonian behavior. This led to an exchange with Kyu-Hyun Chae, who has now posted an update to his own analysis in which he finds MONDian behavior. It is a clear signal, and if correct, could be the smoking gun for MOND. It wouldn’t be the first one; that honor probably goes to NGC 1560, and there have been plenty of other smoking guns since then. The trick seems to be finding something than cannot be explained with dark matter, and this could play that role since dark matter shouldn’t be relevant to binary stars. But dark matter is pretty much the ultimate Rube Goldberg machine of science, so we’ll see explanation people come up with, should they need to do so.

At present, the facts of the matter are still in dispute, so that’s the first thing to get straight.


Thanks to everyone I met at the conference who told me how useful this blog is. That’s good to know. Communication is inefficient at best, counterproductive at worst, and most often practically nonexistent. So it is good to hear that this does some small good.