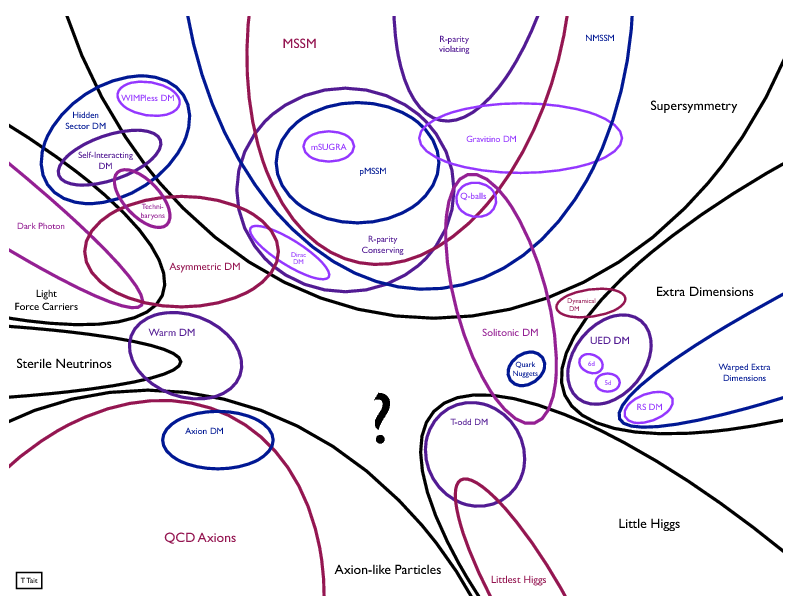
Previously, I made a list of five criteria for a convincing dark matter detection. I discussed the first four, which I hope are obvious to everyone who works in the field, but it seemed worthwhile to write them out explicitly given the hint of a detection by LZ. I left the fifth criterion – that whatever the dark matter is it should naturally explain the observed MONDian phenomenology – to be discussed separately, so that’s what we’ll do here.
Explaining the observed MONDian phenomenology is a high bar. That it does not follow naturally from dark matter should be obvious. It used to be, but apparently it no longer is, so let’s think it through. Indeed, it’s going to take two posts to get through.
First, some definitions:
Cold Dark Matter (CDM): the non-relativistic, non-baryonic dark matter that is standard to cosmology. Usually presumed to be a WIMP, it could in principle be any mass that is slow-moving and does not participate in big bang nucleosynthesis. I will nevertheless assume, as the vast majority of scientists do, that it is some new particle, if not necessarily a WIMP.
Generic Dark Matter (DM): could be any unseen mass, but here I will use it to mean non-WIMP particle DM candidates that don’t necessarily do what pure CDM predicts. For example, warm (WDM) or self-interacting dark matter (SIDM) might produce cored rather than cuspy dark matter halos. So by generic DM I mean any new particle that doesn’t interact with baryons except through gravity. This is pretty much everything that is commonly discussed in particle physics, with only a few obscure exceptions. Cold dark matter is of course a subset of generic DM, but it makes specific predictions, like cuspy halos, while generic DM is just there adding mass.
Modified Newtonian Dynamics (MOND): the hypothesis that the effective force law at low accelerations becomes , where is the acceleration predicted by Newton ( for a point mass M; more generally one must solve the Poison equation for the observed mass distribution). The Newtonian and MOND regimes are connected by an interpolation function so that . The interpolation function is not fundamental and only matters around the transition .
Data wanting explanation
OK, so let’s see how these compare with galaxy data. I’m only going to talk about galaxy data because I’ve talked about everything else in other posts, and to offer a reflection of those who think CMB data are the only form of evidence that matters, to the exclusion of any other contrary evidence. If we adopt the same attitude, then galaxy data already suffice to falsify DM. Note my use of the generic DM there, not just CDM.
So what do we need to understand about galaxies? Their many regularities, as summarized in this table along with whether each of CDM, generic DM, and MOND provide a satisfactorily explanation:
| Observation | [L]CDM | Generic DM | MOND |
| Flat rotation curves | No | Sure | By construction |
| Inner rotation curve shapes maximal disks & diversity | No | Maybe? | Yes |
| Stellar Mass-to-Light Ratios | No | whatever | Yes |
| Baryonic Tully-Fisher Relation | No | No | Yes |
| Radial Acceleration Relation | No | No | Yes |
| Central Surface Density Relation | No | No | Yes |
| Renzo’s Rule (Sancisi’s Law) | No | Maybe? but no, not really | Yes |
| Acceleration scale | LOL no, CDM is scale free | No | Yes |
Satisfactory is doing a lot of work in evaluating whether each case provides a satisfactory explanation. It is easy to find claims in the literature to explain some if not all of these items, but these claims are generally not satisfactory. From the perspective of the current sociology of the field, they don’t need to be: as long as someone asserts that [insert observation] works in [C]DM, the community hears what it wants to hear, mentally checks the box, and files it under “not a problem” even when it remains very much a problem.
Rotation curve shapes: flat far out; baryon-like near-in
I’ve written about all of these things at one point or another here, but for starters, let’s consider flat rotation curves. Flat rotation curves were, of course, a primary reason why we invoked dark matter in the first place. Dark matter can certainly explain flat rotation curves at the level of “anything in excess of the baryonic rotation curve is attributable to dark matter.” This is exactly what generic DM was initially invoked to do. Part and parcel of this early construction was that dark matter was not needed at small radii. For the bright galaxies studied in the ’70s and early ’80s, the stars explained the inner parts of rotation curves quite well, a condition dubbed “maximum disk.” The inner regions were star-dominated, and dark matter only became relevant far out. That’s why I’ve given generic DM a “sure” grade: that’s what it was invoked to do.

It is a low bar to say “any dynamical mass that’s not luminous is dark.” This, by itself, is not a satisfactory explanation: it is just an inference that when what we see falls short, then DM makes up the rest. To become a satisfactory explanation, one would need a theory that predicts this as an outcome. [L]CDM is better than generic DM in that it does make predictions.
CDM predicts NFW halos, at least when left to itself in dark matter-only simulations. These do not lead to flat rotation curves. NFW halos have rotation curves that rise steeply, turnover, then fall gradually. They are not flat over an extended region as routinely observed in real galaxies. In order to obtain the observed flatness requires a combination of baryons plus dark matter. That then requires a good theory for how the luminous galaxy forms, which is a lot more complicated than just an NFW halo. There are now lots of simulations that do this, but they generally don’t agree with each other, so we can’t claim to have a clear prediction from LCDM.
Despite their differences, detailed simulations of galaxy formation do share some common failure modes. Simulated galaxies tend to be too dark matter dominated so that (i) bright, high surface brightness objects often have submaximal disks, unlike real galaxies like NGC 7331 above or our own Milky Way. The shapes of simulated rotation curves tend to (ii) rise too fast relative to the data (those pesky cusps are hard to get rid of) and (iii) the outer rotation curves tend to fall too much, typically having a gradual decline rather than an extended flat portion. I say “tend to” and “typically” because there are a lot of simulations that share these failings, but the details differ from simulation to simulation.
I guess I should give an example. Here is a nice one from the SIMBA simulations:

This is good: it shows us the distribution of the component baryons by phase (atomic gas, molecular gas, and stars), and the total rotation curves*. I think these are good simulation results in that they provide a reasonable depiction of what we should expect in LCDM. They do not look like real galaxies.
Apparently they look close enough to pass casual inspection. They are qualitatively correct in that a lot of rotation curves for bright galaxies go up steeply, peak, then fall some to the flat portion (NGC 7331 is a typical example). However, the rotation curves of these simulated objects illustrate two of the three typical problems noted above: the disks are too submaximal (compare the green dashed lines to the blue line for NGC 7331) and their rotation curves fall too far before flattening out. Here the simulated rotation curves don’t really flatten out at all, a problem I’ve seen in other simulations, not just SIMBA. I find it remarkable that half a century after flat rotation curves helped found the dark matter paradigm, typical simulations in the standard model of cosmology routinely fail to satisfactorily reproduce this essential observational fact.
The third problem is that simulated rotation curves tend to rise too rapidly, which leads to the cusp-core problem. This problem is particularly pronounced in dwarf galaxies, but such low mass galaxies are not well resolved by most simulations. This issue is addressed by specialized, high resolution simulations like those described by Ruan et al. (2025), which I previously discussed in the context of Tully-Fisher. They do a good job of explaining the small scatter in the Tully-Fisher relation if you don’t look too closely into how that is accomplished. They also show example rotation curves, which exemplify the issue with the inner shape:

The suite of simulations from which this example is drawn is one of the better ones in terms of making realistic-looking galaxy-like objects. They are descended from the family of simulations that first claimed to convert cusps into cores. That hasn’t worked out here: the rotation curve of simulated dwarf r614 looks exactly like a cuspy NFW halo. This is what LCDM generically predicts, but real galaxies don’t do that. [Same as it ever was – see Fig. 14 of McGaugh & de Blok (1998).]
Note that I am not saying the simulations are wrong. I think they often do a reasonable job of showing what we should expect for LCDM. What I am saying is that LCDM simulations don’t look like reality. If we believe the simulations get the predictions of LCDM right, then LCDM is falsified. If we don’t want to grant credence to that line of thought, then we either tweak our simulations in an effort to iterate towards something that looks less unrealistic, or simply ignore the uncomfortable aspects of the data. Those two approaches pretty much encompass the past thirty years of the field of galaxy formation.
Regardless of any notional improvements to future simulations, LCDM does not generically get flat rotation curves right – hence the “no” in the table above. I give generic DM a “sure” in this category because the bar is set lower. LCDM at least makes predictions, albeit filtered through the effects of baryonic feedback, which is treated differently by different simulations. There is no prediction for generic DM, so sure, whatever. To illustrate how low this bar is, consider the difference between fitting the data and predicting it. If presented with rotation curve data, we can fit it with any DM halo model you can imagine. In that process, we will reproduce the observed flatness by construction. That’s what a fit does. However, predicting the rotation curve is a much harder proposition. There is no reason to expect baryonic disk+DM halo to result in a flat rotation curve. Indeed, there is only a small sector of the available parameter space where that is the result; it is quite easy to build a plausible-seeming model that has either a rising or a declining rotation curve. I was surprised in my earliest modeling attempts to find just how unlikely the result was to be a flat rotation curve. Lots of subsequent simulations corroborate that without confronting the issue.
Note that MOND, like dark matter, was invented to explain flat rotation curves. That rotation curves are flat happens by construction; there is no evidentiary value in checking this box. Positive evidence does follow from more extended rotation curves than were known at the time of its invention. But aside from that relatively recent development, there’s not much to brag about in the first row of the table for any of the ideas listed there.
The different hypotheses do become distinguishable in the subsequent rows. MOND made specific, a priori predictions for the other entries in the table, and these were all realized by subsequent observations. This behavior, which I refer to collectively as the MOND phenomenology, was not anticipated by dark matter, and is not readily explained by it. Moreover, predictions matter. Even if we do come up with a DM explanation for each of the things MOND predicted a priori, why should we privilege the idea that failed to make the same predictions? This is the opposite of how science is supposed to work.
Rotation curve shapes
We’ve touched on the concept of maximum disk in bright spirals where the inner shape of the rotation curve is stipulated by the observed distribution of stars. This is not expected in LCDM, where the effects of cuspy halos and adiabatic compression combine to preclude disks from becoming maximal – hence the submaximal disks in SIMBA and other simulations. However, feedback can also play a role, so it is not entirely clear what the end results might be for high surface brightness galaxies. (The typical assertion from theory is that high mass galaxies have deep enough potential wells that the impact of feedback is minimal, but that leads to submaximal disks.)
Matters become simpler in low surface brightness galaxies, which are observed to be have large mass discrepancies. This dark matter domination extends to small radii; stellar mass has little influence on the dynamics. Consequently, one expects rotation curves to simply trace that of the dark matter halo. At a given mass, different DM-dominated galaxies reside in pretty much the same DM halo, so should have pretty much the same rotation curve. They do not.
Though long known observationally, this came as a surprise to the simulation community, who coined the term “diversity” to refer to it. They failed to notice that the diversity of rotation curve shapes correlates with the diversity of surface brightnesses: high surface brightness galaxies have rapidly rising rotation curves, low surface brightness galaxies have gradually rising rotation curves. The relation is so strong, it can be seen by eye:

The systematic variation of rotation curve shape with surface brightness is the signature of MOND. Lower surface brightness means lower stellar surface density means lower acceleration means a larger mass discrepancy. Low surface brightness galaxies are inferred to be dark matter dominated as a consequence. Though initially surprising from the conventional perspective, this is exactly what MOND predicted a priori. Milgrom discussed the expected variation in rotation curve shapes in his original series of papers. That’s what is observed above. I have not seen the same effect emerge from simulations, nor do I expect to.
Stellar population mass-to-light ratios
The mass of the stars matters to the dynamics. We observe starlight, but need to know the stellar mass for the physics. The connection between the two is encapsulated by the mass-to-light ratio of the stellar population.
Conventionally, constructing a model or fitting a rotation curve requires a minimum of three physical parameters: one for the stellar mass with its corresponding mass-to-light ratio, and two for the dark matter halo (typically a mass and length scale). That is more parameters than are required to describe the data, so there is considerable degeneracy between them. It’s like fitting a small number of points with a high order polynomial: a fit is not only guaranteed, but entire families of equally good fits are possible. Consequently, the precise value of the fitted stellar mass-to-light ratio does not provide a test; it can be whatever it needs to be and an appropriate halo fit can be obtained.
To fit a rotation curve in MOND, one has only knowledge of the RAR and a single physical# parameter, the stellar mass-to-light ratio. That provides a test. If there is nothing to MOND beyond being a weird fitting formula, then the mass-to-light ratio is a free-floating parameter that will take whatever value is necessary to provide a fit. If instead it corresponds to physical reality, then the fitted stellar mass-to-light ratios should conform to astrophysical expectations for stellar populations.

We know a lot about stars and their evolution. It is possible to build extremely sophisticated stellar population models. These of course have their own uncertainties, but they are good enough to provide a clear expectation for what the stellar mass-to-light ratio should be. As the figure above illustrates, MOND fits return the correct amplitude for M*/L and its variation with color. The expected amount of bandpass-dependent scatter is also apparent: more in the blue, less in the near-IR. One could not hope for better astrophysical agreement.
Tully-Fisher Relation
MOND correctly anticipated a number of striking features about the Tully-Fisher relation. People seem to obsess about the slope; MOND predicts while the dark matter halo version of this is . We observe the former. The latter isn’t a prediction for what we can see, so modeling is required. There exist many models, so there is no clear consensus on what LCDM predicts. It certainly didn’t predict , which I guess is why people obsess over this aspect of the observation and complain as the slope has converged to that value with increasing precision as the data have improved.
LCDM models that adhere to abundance matching naturally predict curvature in Tully-Fisher. This is a generic expectation that necessarily arises when mapping the curving shape of the galaxy luminosity function to the power law of the DM halo mass function. A representative example is provided by the model of Sales et al. (2017) (red line in plot). This model does OK for a range in mass, but departs from the data at both high and low mass ends.

There are other aspects of Tully-Fisher that are problematic for the dark matter picture. More concerning to me than the slope is the small scatter. If one goes through the exercise of tabulating the scatter budget, one finds that it should be large. There are many sources of potential variance, including that from halos themselves. At a given mass, halos should come in a range of concentrations; that by itself exceeds the observed scatter budget, which is entirely explained by the expected amount of scatter in the mass-to-light ratios of stellar populations.
Another prediction of MOND that sits uncomfortably with dark matter is the absence of second parameter effects. Newton says ; both mass and radius matter to the velocity. Yet radius is not observed to be relevant, only the mass, as predicted by MOND: . Explaining this with dark matter requires suppressing the dependence on radius, which in turn requires an unnatural fine-tuning between the luminous and dark matter components. It was this that made me start to doubt dark matter before I was cognizant of MOND. When I learned that MOND – and only MOND – predicted this absence of second parameter effects is when I started to take it seriously.
Radial Acceleration Relation
The naive expectation for rotation curves in LCDM follows from placing an exponential disk in an NFW halo. This is the second thing I tried, before the turn of the century, after first trying then-standard pseudo-isothermal halos. This doesn’t work to reproduce the Radial Acceleration Relation (RAR) (or the Mass Discrepancy-Acceleration Relation as I called it back then).
My inability to explain the RAR wasn’t for lack of trying. If it were natural, it would follow naturally, and I would have said so in the ’90s. It did not because the RAR is not natural in terms of dark matter, only in terms of MOND. This used to be obvious to everyone. For example, at a 2006 conference in New Mexico, I said let’s ignore MOND and carefully explained how the data led to what we now call the radial acceleration relation without reference to MOND. As soon as I finished, Anatoly Klypin SHOUTED: “WE DON’T HAVE TO EXPLAIN MOND!”
But we do have to explain the data, which was the whole point of my talk and the paper it was based on (McGaugh 2004). The RAR is in the data, whether you know about MOND or not. Plausible dark matter models could do any number of things that are not that. It’s not my fault that instead the data look like MOND. So, to explain the data, you do have to explain why dark matter looks like MOND (whether you realize it or not), which, as Anatoly correctly grasped, makes no sense whatsoever.
Can a dark matter model be contrived to look like MOND? That was the charge to the galaxy formation community: I wrote McGaugh (2004) to explicitly lay out what we had to do to explain the data conventionally. Nobody took up the challenge. Most of the citations to that paper are MOND-related, it did not draw much response from the intended audience (unless it was a decrease in invitations to speak at conferences like the one in New Mexico). It was old news to me – I had spent several years expanding and vetting the data from the 1998 edition – but I guess it was still too soon to register with most scientists.
The biggest uncertainty in 2004 was the mass-to-light ratios of the stellar populations. I tried a number of prescriptions for these. The RAR was apparent in each; only the best-fit acceleration scale and the amount of scatter varied. So I left that as an “out” – one didn’t have to adopt the same M*/L that MOND fits found (though you need to be close; see above) and wrote the mathematical requirements for the DM halo in all generality. Crickets.
We spent a decade improving the situation with M*/L by acquiring near-IR data. When Federico Lelli first used these to construct the modern RAR, the scatter caused by uncertainty in the previous optical M*/L collapsed to practically nil. The RAR emerged as a tight empirical relation, a result so remarkable that it is in effect a Law of Nature.
This time (2016) the galaxy formation community took notice and fell all over itself to draw the wrong conclusion. Instead of evincing angry denial like Klypin, numerous papers suddenly asserted that the RAR happens “naturally” in LCDM models. If it were so natural, why had the community denied it so hard for so long? This assertion of naturalness is the greatest abuse of scientific language in modern times: there is nothing remotely natural about it; we had already demonstrated this. Those lessons had already been forgotten (if ever learned), but in the intervening time, people had been busily tweaking their models to make them more like data, so if you didn’t know any of the relevant history, or how badly previous models had failed, the assertion that it is all natural might seem reasonable. I guess. It really is not.
In order to build a galaxy formation model, one has to construct a model for both the visible galaxy and its parent DM halo. One of the huge unknowns in this game is how to assign the galaxy we see to a dark matter halo we do not. The standard approach in the 1990s was to assume a constant relation between the mass of the observed galaxy and that of its host dark matter halo. Mo et al. (1998) did this (“the masses of disks are a few percent of those of their haloes”); I made the same assumption in my modeling efforts. It gradually became clear that this could not work, and subsequently abundance matching became the norm for making this assignment. This collapses the dynamic range in halo mass relative to that in galaxy stellar mass, which makes models look like galaxies all live in nearly the same DM halo, which goes in the right direction.
One claim that the RAR is natural in LCDM comes from Navarro et al. (2017). They add exponential disks to NFW halos, duplicating the exercise I tried twenty years earlier. It appears to work better now because they adopt abundance matching to assign DM halos to galaxies rather than the original assumption of a constant ratio of baryons to dark matter that we all made in the hopes of avoiding this becoming a rolling free parameter. The reduced dynamic range in halo mass that follows from abundance matching has the benefit of collapsing models to approximate the RAR, at least over a finite dynamic range. This is illustrated by this plot I made four years ago but I don’t think I’ve published previously:

The data here are kinematic data from our own work plus weak gravitational lensing from Brouwer et al. (2021). Both have been improved since I made this, in particular with the reanalysis of the lensing data by Mistele et al. (2024). Rather than remake the plot, it is informative of how the data improve over time. The lensing data are more reliable where the target galaxies are most likely to be isolated (filled points); less reliable data beyond this region are shown as open points.
Two sets of LCDM models are shown in the left panels. Both have four lines that correspond to the four mass bins used in the weak lensing analysis. The pink lines are the simplest possible: exponential disks in NFW halos. This is identical to the model of Navarro et al. (2017) except that I’ve used Kratsov’s abundance matching relation because this works better for this purpose. The green lines from Li et al. (2022) are similar, but additionally include the effects of adiabatic compression. I omit more complicated models from simulations because the plot becomes incomprehensibly busy. They don’t improve matters.
Over the range , the LCDM models appear to match the observed RAR. This much supports the claim that LCDM explains the RAR. Is it satisfactory? Is it sufficient?
If one zooms in, as seen in the residuals in the lower panel, the lines for the individual models segregate. This is not obvious in the RAR itself, where the logarithmic scale necessary to display the large dynamic range of the data compresses and conceals such unpleasant details. There is no such mass segregation in the data: all galaxies fall on the same RAR, within the uncertainties.
Another detail that becomes apparent in the residual diagram (which is mysteriously absent in all the papers I’ve seen claiming this works in LCDM) is that the models do not have the right shape. From high to low accelerations, the pink lines dip below the data, then above, then below again. At low accelerations, they dive very much below: the models cease to even come close to working at . Their utility is limited to a narrow dynamic range: they are neither satisfactory nor sufficient.
The models considered here do not probe the high acceleration end of the RAR. This is an artifact of the simplicity of the exponential disk plus NFW halo model. Such models never reach high accelerations because those are the province of bulge components. Without those, the models end in little hooks: they are turning away from the RAR at the highest acceleration plotted. There’s no reason not to plot to higher acceleration, but it would make the models look worse – the hooks would grow in the wrong direction. I’ve made the conscious choice – as I’ve noted others have – not to show the ugly parts of this model. The difference is that I don’t pretend it works by virtue of not looking where it doesn’t work.
The models from Li et al. (2022) that include adiabatic compression are represented by the green lines. These do better than the simple exponential disk plus NFW halo models insofar as the are less bendy. But they still segregate by mass, and dive to lower accelerations even faster.
I’ve tried various simulations in this plot but I have yet to find one that does well. The turn down at low accelerations occurs at large radii where feedback effects are usually said to be minimal, so that is not a likely solution. Indeed, the problem is generic. Low accelerations probe the outer regions of CDM halos where the robust prediction from simulations is a density profile that scales as , but the data scale as as required to produce a flat rotation curve. Consequently, the mismatch between CDM and the RAR at low acceleration is serious.
In contrast, MOND does fine. It explains the data at all observed acceleration scales, not just a narrow window. The agreement now is better than is depicted with these older data, but this is already good. The only objection one might raise is that the lowest accelerations obtained from gravitational lensing for early type galaxies are offset from the prediction of MOND. (The open triangles sit above the zero residual line in the lower right panel.) This is largely rectified in subsequent analysis, as an experienced astronomer might expect, but this didn’t prevent people from leaping at this mild discrepancy as evidence against MOND. It would be, if it were true. It would also be bad news for LCDM, as these same data are even more discrepant from the models at left. This is a good example of the bias that infects the field: any discrepancy from MOND is seen as a win for dark matter – even when dark matter suffers the same problem (or worse).
Central Surface Density Relation
In MOND, the observed mass determines the kinematics through the modified Poisson equation. Just as lower accelerations mean larger mass discrepancies, so too do lower surface densities mean lower accelerations. Consequently, one expects a relation between the characteristic surface density of a galaxy and the amplitude of the mass discrepancy it evinces. In ignorance of that, Erwin de Blok and I discovered that low surface brightness galaxies were dark matter dominated. It wasn’t just “gee, there’s a lot of dark matter here;” the amplitude of the discrepancy correlates with central surface brightness.
This can be quantified by the central surface density relation:

This relation involves the central regions of galaxies. High surface brightness galaxies are far enough in the Newtonian regime () that they follow the one-to-one line: what you see is what you get. Lower surface brightness galaxies diverge from the one-to-one line, having systematically lower accelerations () and larger mass discrepancies (i.e., they appear to need more dark matter) as surface brightness decreases. There is no reason for this behavior in dark matter, for which the central surface density of stars is not a parameter of obvious relevance.
The central surface density relation is both natural and expected in MOND. I am not aware of a dark matter model that addresses this relation. The correlation with mass (right panel above) is often discussed, and is considered to be deeply meaningful by some. However, the correlation in the right panel occurs entirely because stellar mass correlates with surface brightness, albeit imperfectly, so the right panel is a blurry version of the left panel. The surface density of stars is the important parameter here, not their total mass.
Renzo’s rule
There are other ways to see the connection between kinematics and the distribution of observed baryons. Indeed, a connection was recognized empirically by one of the great 21 cm observers, Renzo Sancisi. To quote from his abstract from IAU 220:
In the inner parts of spiral galaxies, of high or low surface brightness, there is a close correlation between rotation curve shape and light distribution. For any feature in the luminosity profile there is a corresponding feature in the rotation curve and vice versa. This implies that the gravitational potential is strongly correlated with the distribution of luminosity: either the luminous mass dominates or there is a close coupling between luminous and dark matter.
The shape of the rotation curve correlates with the shape predicted by Newton for the baryons:

This phenomenology is common enough for Prof. Sancisi to notice through the experience of looking at lots of data. Indeed, he said it to me in person in 1995 when we had a heated debate about the interpretation of the Tully-Fisher relation. The correspondence he noted implies that baryons are important to the mass budget, in both high and low surface brightness galaxies. In contrast, the absence of surface brightness-dependent residuals in the Tully-Fisher relation implied that LSB galaxies were certainly sub-maximal, and HSB galaxies as well if one desires to avoid fine-tuning.
Our discussion was heated in the best way. We weren’t angry, just engaged. We understood both things could not be true, but apparently they were. I redoubled my efforts to look for residuals from Tully-Fisher, ultimately finding none after many years of checking. Renzo held off on publishing his statement (for eight years!) while he looked at more LSB galaxies. Both results were sustained at the level expected for astronomical data despite the contradiction they encapsulate.
The correspondence of features (sometimes referred to as “bumps and wiggles”) in galaxy luminosity profiles and rotation curves makes sense in HSB galaxies if they are maximal in the sense discussed above. If instead dark matter dominates, there is no reason for the rotation curve to reflect the features in the baryons. Indeed, it cannot: the observed bumps and wiggles are typically features like spiral arms that require disk self-gravity to support them. The dynamics of quasi-spherical dark matter halos simply can’t support features like that – the phase space of particle orbits is too different. Even if they could, which they can’t, there would be no reason for the correspondence: the DM halo might have its own features, which if its mass dominates, could be anywhere, not where we see features in the stars.
This issue becomes more pronounced in LSB galaxies. Since the mass discrepancy is large at all radii in LSB galaxies, the mass of the DM halo always dominates. There should never be a correspondence of features, and yet there are.
The only theory that satisfactorily explains both the correspondence of features in Renzo’s rule and the absence of surface brightness-dependent residuals from Tully-Fisher is MOND.
The acceleration scale
Threading throughout the data is the acceleration scale suggested by Milgrom. This shows up in the data in many ways. Three of these are summarized in this plot from the review by Lelli (2022):

The BTFR shows that all galaxies share the acceleration scale . The acceleration scale is where the RAR bends away from Newtonian behavior. Similarly, the surface density of the bend in the central surface density relation, , marks the acceleration . These relations need not exist at all in a universe dominated by dark matter. Even if they do for some reason, there is no reason to expect they all share the same acceleration scale. Yet within the uncertainties, they do: .
Cold dark matter is scale free, so an acceleration scale is not natural to it. That doesn’t prevent people from asserting it is. Kaplinghat & Turner (2002) do just that. The absurdity$ of this claim was immediately pointed out by Milgrom (2002), but this has not precluded either Kaplinghat or Turner from continuing to assert that they’ve explained that which they have not remotely explained. It’s more like a political talking point than science.
Exceptions
The table above lists some of the rules that the vast majority of galaxies obey. I emphasize vast majority because relations like Tully-Fisher would be unrecognizable if there were lots of exceptions. It wouldn’t be a relation at all. We need to understand the rules the majority obey – which we do not in the context of dark matter – before obsessing about potential exceptions. To do the latter is a classic case of missing the forest for the trees.
There are always exceptions in astronomy. These come in several flavors: (i) goofs, (ii) apparent exceptions that actually prove the rule, and (iii) genuine exceptions that falsify a theory (anomalies). The first category is extraordinarily common in astronomy, the second can take a long time to recognize, and the third are rare if they exist at all. New examples in each category are always being discovered, so it is a Sisyphean task to check every case.
The most common flavor of exception in astronomy is the straight-up goof (i). These are so common, the experienced astronomer is rightly skeptical of a story that lacks exceptions. In the case of MOND, there have been many galaxies that appear to be problematic but later turn out not to be. They’re just goofs. There have been so many examples of this, I have lost count. Over a hundred, easily.
The ultra-faint dwarf galaxy Boötes III provides a recent example of an ordinary goof. Ultrafaint dwarfs often have velocity dispersions well in excess of that predicted by MOND, but it is challenging to measure dispersions as low as predicted. In this case, Ting et al. (2026) “measure a velocity dispersion of σv = 1.69 +1.03/−0.85 km s−1, about six times smaller than the previously reported 10.7±3.5 km s−1.” The larger number has been known for a while and is strongly inconsistent with MOND; the new measurement is pretty much bang on what MOND predicts. Consequently, one can see how it is easy to leap to the wrong conclusion, especially with confirmation bias standing behind you ready to push as you look out over the cliff.
Apparent exceptions (ii) are outliers that appear to violate a rule, and do so with high significance. In these cases, it is the rule that is not always universal. Relations like the BTFR and RAR are predicted by MOND and hold for the vast majority of galaxies. There are, however, some genuine outliers.
One can imagine building a DM model that reproduces these things. (I’m not even requiring it to be satisfactory for the moment.) Then, when one encounters an object that falls off these relations, you might conclude MOND is wrong and the DM model is better because DM tolerates outliers better (often by virtue of having no good reason for the relation in the first place). Some objects happen not to follow the statistical happenstance of the DM model, while you can’t turn off the force-law in MOND, so the rule must always apply. Right?
The problem with this reasoning is that MOND does predict exceptions. Objects for which the external field is important should deviate from the main relation that holds for isolated galaxies. I have seen many cases where what looks like a failure of MOND is actually a corroboration once you consider the external field. Such cases are a problem for our hypothetical DM model: once we construct something up that explains a relation like the BTFR, outliers can happen, but should not depend on the acceleration of from an external field. The external acceleration from some external source simply has no role to play in dark matter models.
Finally, there are genuine anomalies (iii) that would indeed falsify MOND. Most examples that I have seen that seemed to be in this category have later turned out to be in one of the first two categories: simple goofs or predicted exceptions. Some cases are still under litigation, and new examples will be discovered in the future. Do I know that all these will all work out? No, of course not. Have I seen this movie enough times to have a well-founded empirical expectation that they probably will? Yes, I have.
Dark Matter as extra, invisible mass is practically falsified
Look at the table above again. Time after time after time, new observations have been made that were not predicted by dark matter but were by MOND. Dark matter simply does not succeed in predicting galaxy dynamics the way MOND does. That’s very telling.
Many scientists choose to ignore MOND’s predictive success, or have sought to downplay its importance. When they bother to do the latter, they usually restrict themselves to a single item, often in apparent ignorance of the rest of the table. For example, a common talking point is “MOND only fits rotation curves!” Never mind that “only” here is a falsehood. The “mere” ability to fit rotation curves is already a highly non-trivial result. Each and every galaxy has its own unique mass distribution and poses a separate test of MOND, just as every planet and every comet and every asteroid test Newton’s law of gravity in the solar system. We’ve made hundreds of these tests: the effective force law in galaxies is MOND.
More generally, it isn’t just that the relations listed in the table above were correctly predicted by MOND and not by dark matter. It is also that the post hoc dark matter explanations are not satisfactory. Sometimes they are mutually contradictory.
The only way to save dark matter is to contrive for it to look like MOND. It is hard to think of a more damning statement about an otherwise nebulous hypothesis. Dark matter could be anything, do anything, and yet the one thing it has to do is mimic the very precise and comparatively inflexible predictions of its chief rival.

Can a dark matter model be contrived to look like MOND? Many have claimed to do this, even asserted that it happens “naturally.” This latter assertion is the greatest abuse of scientific language in modern times: there is nothing remotely natural about it. If it were natural, it would follow naturally, and I would have found that and said so in the ’90s. A corollary is that the people who claim now to explain it naturally would not have spent the intervening decades loudly denying that it could be so before they suddenly knew it all along. Lord knows I’ve tried to build acceptable DM models, and there are always more (increasingly silly) things to try, so when I say that I do not think it can be done, at least not with conventional flavors of DM, it is a highly nontrivial statement^.
When the dark matter paradigm took off, we had lots of indications of mass discrepancies. Flat rotation curves required more mass than they eye could see; the gravitating cosmic mass density exceeded that attributable to baryons. The vast majority of dark matter candidates currently being contemplated are informed by that perspective. As such, they simply come up with a new particle that could provide the extra mass.
That approach was sufficient in the 1980s, but since then new shit has come to light.
Many items in the table above constitute new stuff that has come to light since the DM paradigm was established. It isn’t just that rotation curves are flat and therefore we need more mass. It is also that the amplitude of the flat rotation speed correlates with the baryonic mass (the BTFR). And that the kinematic acceleration correlates with that predicted by Newton for the observed distribution of baryons (the RAR). And the rest of the table. New shit has come to light! These things did not inform the development of the dark matter paradigm, and are not explained merely by invoking invisible mass. We need to reexamine the paradigm in that new light.
The BTFR and the RAR and the other observations detailed above all point to a strong connection between baryons and dark matter, completely the opposite of the original mandate. Extra, non-interacting, invisible mass might still suffice for cosmology, but explaining galaxy dynamics is more demanding. Just adding invisible mass does not explain the strong coupling with the observed distribution of ordinary baryons. A viable dark matter candidate needs to do this, but the vast majority of them have been constructed in ignorance (or denial) of the need to explain the MONDian phenomenology.
I can imagine a non-generic DM candidate might be engineered to satisfy all needs. There are candidates that attempt to do this, like dipolar dark matter or superfluid dark matter. This post is long enough, so I won’t say more about those here. What I am convinced will not work is relying on feedback to somehow change the essence of CDM to mimic MOND. That’s a pipe dream akin to profiting from stealing underwear.

The observed kinematics of galaxies as described above suffice by themselves to provide a practical falsification of dark matter as widely conceived – either CMD specifically or generic extra-mass DM, excepting only highly specific ideas that build-in MOND-like behavior. (I say a practical falsification because outright falsification is impossible with unseen entities.) There are other, independent reasons to doubt DM, like the apparent absence of the expected dynamical friction due to dark matter. There are of course reasons to persist with DM, but it needs to be more than some random particle that just adds mass to the universe.
It is not possible to make progress in the context of dark matter without addressing the observed phenomenology described above as a whole rather than the common, piecemeal, divide-and-deny approach. We will not consider alternative theories until we agree that dark matter, as currently conceived, is wrong. We are stuck in a rut, and have been for a long time.
*It also shows the rotation curve that would be measured from the gas, which differs from the actual rotation curve in many simulations. This seems to have led many simulators to disbelieve observed rotation curves, but this is a simulation problem not an observational problem. We know how to recognize and correct for non-circular motions in the data. These corrections are usually small and the data never look like these simulations. It’d be really obvious in the velocity fields of real galaxies were messed up in this way. (Real galaxies are often messed up, just not in the ways seen in LCDM simulations.)
#There can also be nuisance parameters like distance and inclination. These are measured independently and ideally would be held fixed, but of course there are uncertainties on these values so one can marginalize over the range of allowed possibilities. The same is true in DM halo fits.
$Milgrom’s rebuttal is quite thorough, so I don’t want to pile on. But the acceleration scale appears in diagrams like the RAR that plot an observed kinematic acceleration () against one obtained from the observed baryons (). In terms of dark matter, . K&T talk about the dark matter; but have no model for the baryons, which are essential to both axes of the RAR. They make a hand waving argument that corresponds to the edge of galactic disks, which it does not – that’s what low surface brightness galaxies had already taught us by then. So they don’t explain the acceleration scale at all.
^I’m sure galaxy formation theorists can be found who will sanguinely assure us that all that needs to be done can be done, it’s just a matter of tweaking this or that. So why haven’t they succeeded in thirty years of effort? So far, they’ve mostly just come up with more elaborate versions of models I already tried and rejected as obviously unworkable. Making them more elaborate doesn’t make them less wrong.